Tech
Which States Have the Best and Worst Bridge Ratings?

The U.S. continued a trend of reducing the number of bridges rated poor between 2020 and 2021. However, the number of good rated bridges also dropped.
For the past several years, bridges rated fair have made up the largest segment of the nation’s bridge inventory, and it’s a growing category, indicating that states continue to lose ground on maintenance.
Welcome to the Better Roads Bridge Inventory, an annual survey conducted since 1979 to examine the condition of our nation’s bridges. This year, departments of transportation in 38 states responded between October 16 and December 17 to the annual Equipment World survey. The survey was sent to the bridge engineering divisions of all 50 states and the District of Columbia.
States were asked to report the number of bridges rated good, fair and poor in their states. We also asked them to report the total amount of bridge deck area in their states and what percentage is rated poor, among other questions.
For states that did not respond, we used the Federal Highway Administration’s 2021 Bridge Inventory data.
What follows are some snapshots from the survey, ranking the states in various categories. At the end of the article, we provide a detailed look at overall conditions of the bridges in each state, so you can see how your state stacks up.
Bridge condition ratings
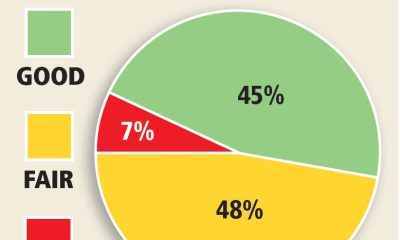
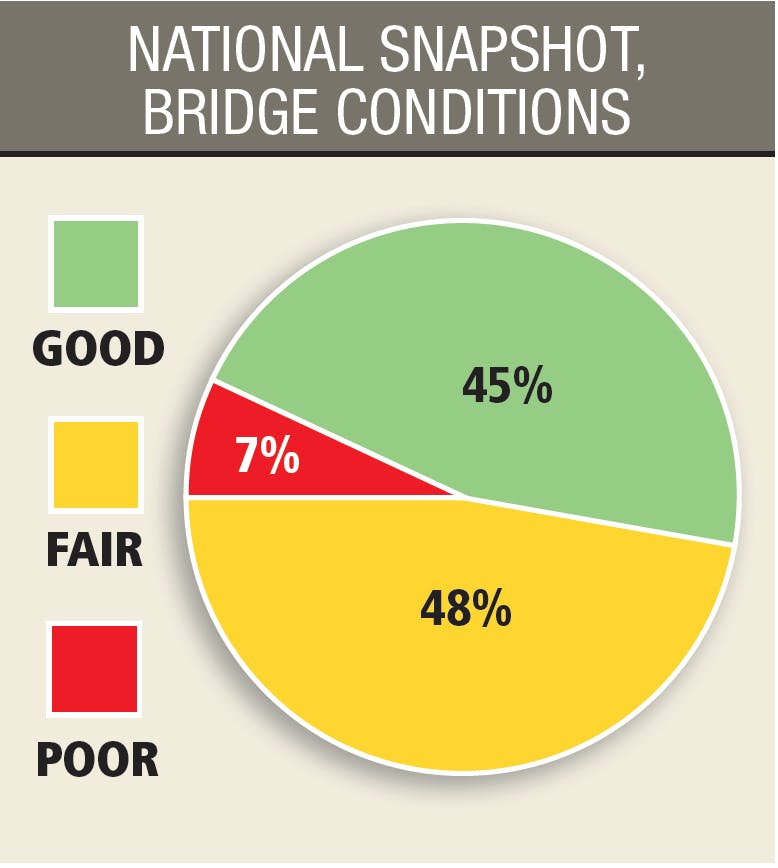 Overall percentages of U.S. bridge ratings for 2021.Equipment WorldBefore we delve into the state bridge rankings, let’s take a look at what the ratings mean.
The Federal Highway Administration asks states to rate bridges that are 20 feet or longer as “Good,” “Fair” or “Poor.”
GOOD – Bridges in this category range from excellent to some minor problems.
FAIR – Ranging from bridges with structural elements showing some minor deterioration, to bridges in which all primary structural elements are sound but may have minor section loss, cracking, spalling or scour; and may include minor erosion on bridge piers.
POOR – There are five categories of poor bridges:
- Poor – Advanced corrosion, deterioration, cracking or chipping. Also significant erosion of concrete bridge condition piers.
- Serious – Loss of section, deterioration, spalling or scour have seriously affected primary structural components. Local failures are possible. Fatigue cracks in steel or shear cracks in concrete may be present.
- Critical – Advanced deterioration of primary structural elements. Fatigue cracks in steel or shear cracks in concrete may be present or scour may have removed substructure support. Unless closely monitored, it may be necessary to close the bridge until corrective action is taken.
- Imminent Failure – Major deterioration or section loss present in critical structural components, or obvious loss present in critical structural components, or obvious vertical or horizontal movement affecting structural stability. Bridge is closed to traffic, but corrective action may be sufficient to put the bridge back in light service.
- Failed condition – Bridge is out of service and beyond corrective action.
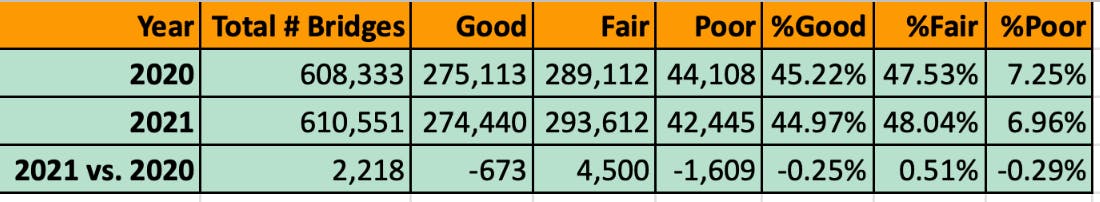 A breakdown of national bridge ratings, comparing the 2020 Better Roads Bridge Inventory to the 2021 inventory.Equipment WorldRanking the states
Note: An * beside a state indicates that 2021 FHWA National Bridge Inventory data were used.
States with the lowest percentage of poor rated bridges
- Arizona – The state continues to hold the top spot with the lowest percentage of bridges rated poor at 0.84%. That’s a decline from 1% in 2020.
- Nevada – Rose slightly to 1.41% from 1.3% in 2020, but still holds second place.
- Texas – Reduced poor bridges to 1.42% from 1.5% in 2020, remaining in third place.
- Delaware – Rose from fifth to fourth place, with 1.52% of bridges rated poor. That’s down from 1.9% in 2020.
- Utah – Dropped from fourth to fifth place with 1.8% poor, which is the same as 2020.
States with highest percentage of bridges rated poor
- West Virginia – One-fifth of the bridges in the state (20.22%) are rated poor. That’s a slight drop from 2020’s 21%, but not enough to raise it from being the state with the highest percentage of poor rated bridges in the country.
- Iowa – Maintains its position at second-highest with a slight drop from 19.1% to 18.87%.
- South Dakota – Dropped in the rankings from fourth-highest in 2020 with 17.7% of bridges rated poor to third-highest. The state reported 17.43% of its bridges rated poor in 2021.
- Rhode Island – The state continues its rise from last place, where it ranked in 2019 and for many years prior. In 2020, it moved up to third-highest, and this year it has risen to fourth-highest, at 17.33%. That’s a drop from 18.4% in 2020.
- Pennsylvania – The state continues to reduce its number of poor rated bridges, but not enough to raise its rank in this category. It reported 13.83% of its bridges rated poor, which is a drop from 14.6% in 2020.
States with the highest percentage of bridges rated good
- Georgia – The state moves into the top spot at 75% of its bridges rated good, rising from fourth place in 2020 when 62.3% of its bridges were rated good.
- Florida – Drops from first place to second, with 65.29% of its bridges rated good, a slight drop from 2020.
- Arizona – Drops from second to third place, with 64.46% of its bridges rated good, which is up from 63.9%.
- Ohio – Rises from fifth place to fourth, with 60.85% of its bridge rated good, up slightly from 60.4%.
- Mississippi – Drops from third to fifth place, with 59.26% of its bridges in good condition, down from 62.77%.
States with lowest percentage of bridges rated good
- Rhode Island – 21.69%
- Hawaii* – 22.81%
- West Virginia – 23.27%
- Massachusetts* – 25.19%
- Idaho – 25.84%
States with highest percentage of bridges rated fair
- Hawaii* – 69.71%
- Idaho – 69.03%
- District of Columbia* – 67.07%
- Montana – 66.71%
- Connecticut – 66.28%
States with lowest percentage of bridges rated fair
- Georgia – 23.03%
- Florida – 31.51%
- Mississippi – 33.56%
- Ohio – 34.62%
- Arizona – 34.7%
States with lowest percentage of bridge deck rated poor
- Utah – 0.86%
- Georgia – 1.02%
- Arizona – 1.03%
- Texas – 1.13%
- Delaware – 1.26%
States with highest percentage of bridge deck rated poor
- District of Columbia* – 34.21%
- Rhode Island – 19.47%
- West Virginia – 14.51%
- Illinois – 12.21%
- Massachusetts* – 11.27%
See how your state compares
Below are a series of charts to give a broader look at the nation’s bridge inventory as derived from the Better Roads Bridge Inventory and 2021 FHWA National Bridge Inventory data:
Ranking all states by percentage of good, poor and fair bridges
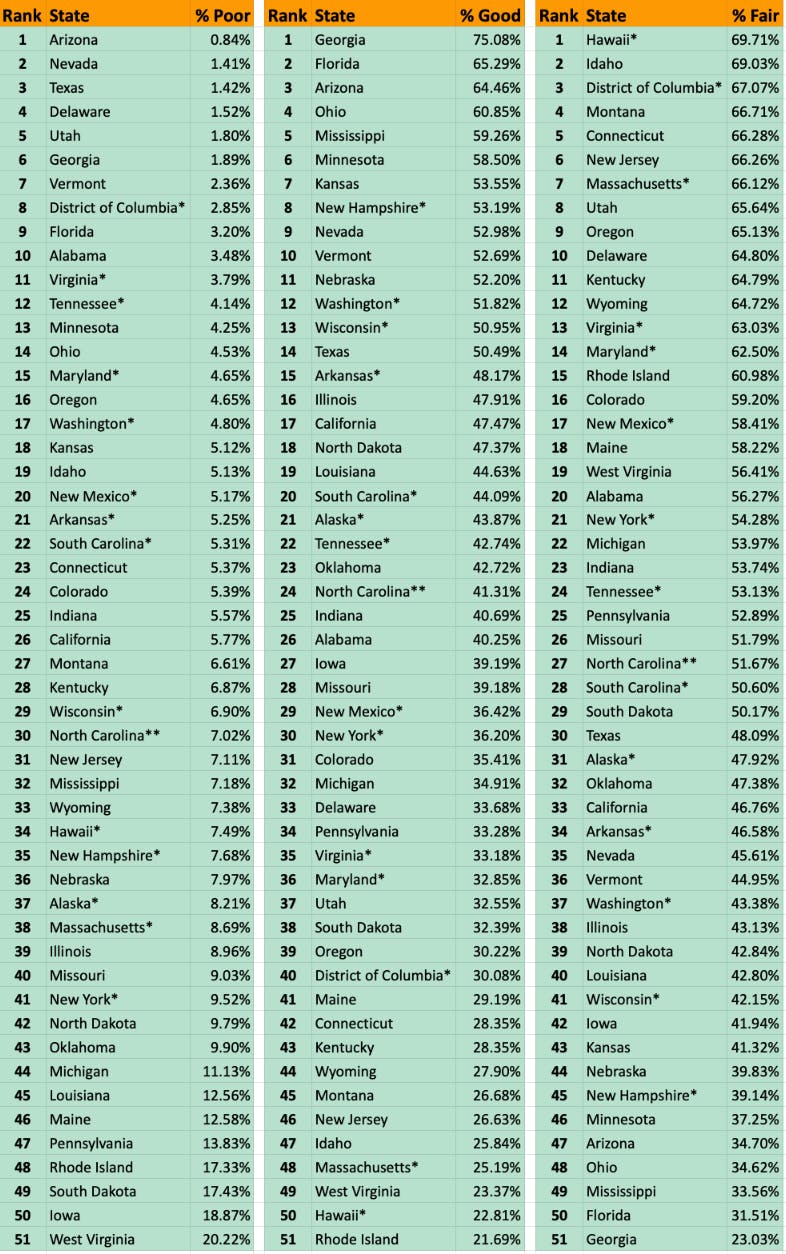 * Source: 2021 FHWA National Bridge Inventory data
** Includes culvertsEquipment World
Ranking all states by percentage of bridge deck area rated poor
 * Source: 2021 FHWA National Bridge Inventory
** Includes culvertsEquipment World
A detailed look at all of the states’ bridge ratings
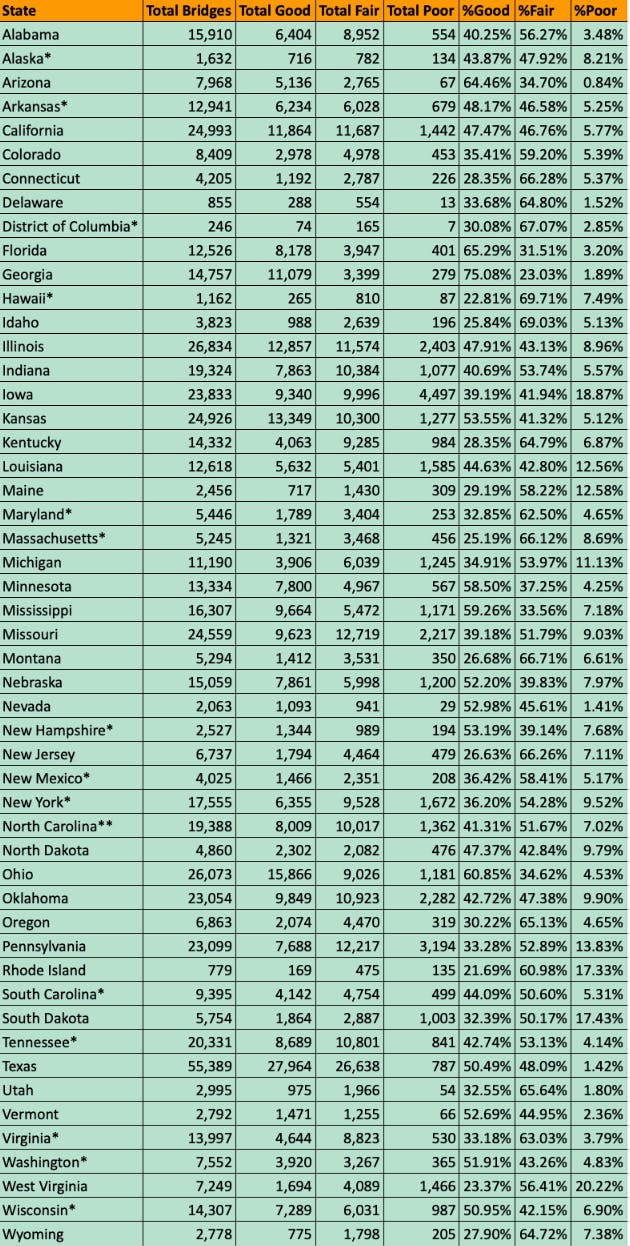 * Source: 2021 FHWA National Bridge Inventory
** Includes culvertsEquipment World


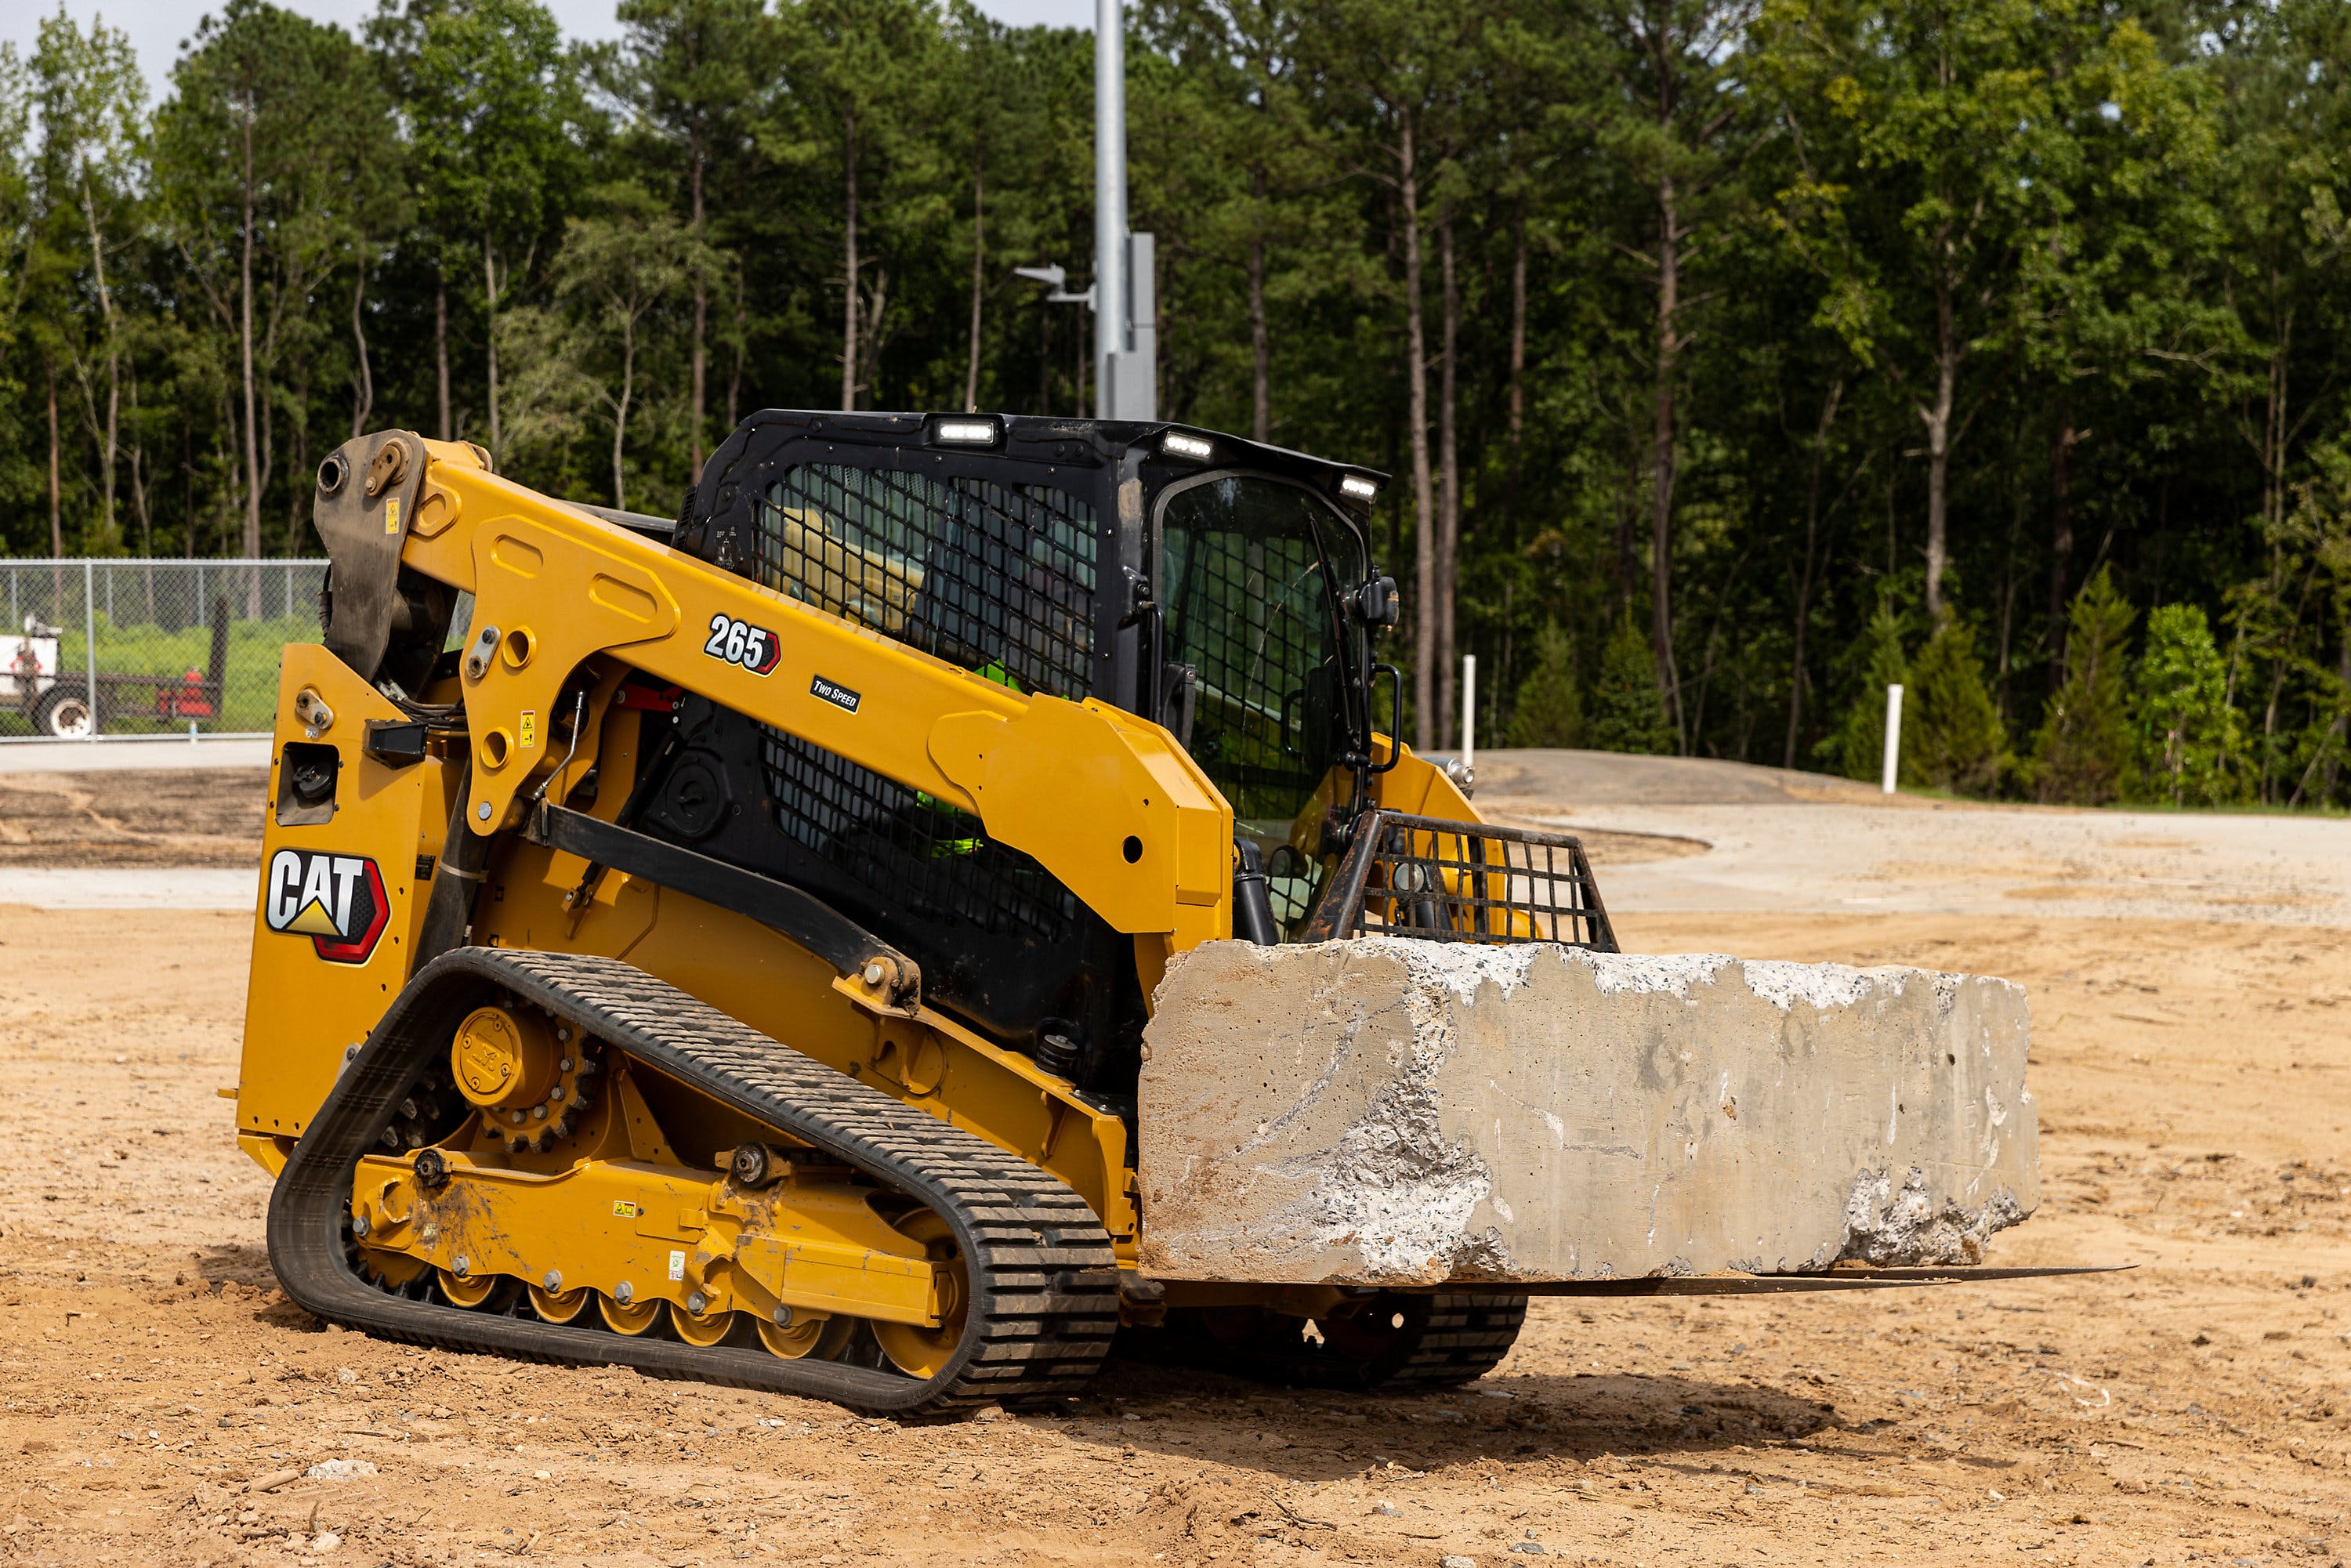
Caterpillar is bidding farewell to its 259D3, 279D3 and 289D3 compact track loaders with the introduction of its new, next-generation 255 and 266 models.
The completely redesigned models debuted at media and customer events at Caterpillar’s Edwards, Illinois, Demonstration and Learning Center last week. The 255 and 265 offer improved engine performance, more lift height, a roomier cab and more standard technology than their predecessors.
“We kept the DNA of the D3 series while reimagining the possibilities of loader performance using voice of customer feedback to lead the way,” says Trevor Chase, product application specialist for Caterpillar. “Both next-generation models leverage the many benefits offered by the vertical lift design. The new Cat 255 replaces the 259D3, while the 265 replaces both the 279D3 and 289D3 machines.”
The CTLs are the last of Cat’s building and construction products to get the next-generation treatment and simplified nomenclature. The first number (2) represents the skid steer loader and compact track loader machine family; the middle number (5 or 6) designates the machine size; and the ending number (5) is the compact track loader identifier. Skid steers will be identified by a 0 end number. Additional new models will roll out in the coming months, the company says.
 CaterpillarMore power and torque
Cat equipped the 255 with a C2.8T engine and the 265 with a C2.8TA engine, both at 74 horsepower. This gives the new machines a significant boost in torque – 13% for the 255 and 43% for the 256 – over their D3-Series predecessors. The engine and cooling package are mounted lower in the frame for added visibility out the rear window and stability while lifting heavy loads.
Customers attest that the added lift height makes truck loading easier. The 255 offers 10 feet 4 inches of lift height, while the 265 can reach 11 feet high.
“The lift height has made a big difference when loading trucks,” said Derrick Roger, owner of Coast to Coast Lawnscapes, who spent several months testing the 255. “You can get on top of that truck now and empty the bucket; whereas, before you would have to shake the bucket to try to get the material to fall out.”
The 255 delivers 36% more tilt breakout, 26% higher lift breakout force and a 24% increase in rated operating capacity (ROC). The 265 also delivers 19% higher tilt breakout force and 22% higher lift breakout force.
Standard hydraulic pressure has been increased to 3,500 psi, allowing the 255 and 265 to operate all Cat Smart Attachments with the standard auxiliary hydraulics provided.
If demanding attachments require additional hydraulic flow, customers can have their Cat dealer activate the high flow functionality on the machine or remotely via software update. This makes it possible for the CTLs to hit 30 gallons per minute of flow at the standard system pressure.
A High Flow XPS factory option increases auxiliary hydraulic system pressure to 4,061 psi for both models, while also increasing the hydraulic flow to 30 gallons per minute for the 255 and 34 gallons per minute for the 265.
The torsion suspension undercarriage delivers better operator comfort, track wear and material retention, plus the stiffer design results in smoother graded surfaces, Cat says. A new 12.6-inch bar-tread narrow track option is available on the 255.
A more spacious cab
Cat says it has increased the cab width by 2.75 inches without making the machines wider and the footwell-to-ceiling height by 1.8 inches. The larger cab gives operators an additional 1.5 inches of hip room and 1.1 inches more width between the joysticks.
A range of new mechanical and air-ride suspension seat options are available, including a ventilated and heated seat. A new automatic temperature control allows operators to set a specific temperature. Relocated vents help cool or heat the machine quickly.
The standard package includes the same 5-inch LCD monitor as the D3 Series CTLs, which offers Bluetooth connectivity and functionality for the rearview camera feed, creep, job clock, and maintenance reminders.
Customers can upgrade to a new 8-inch advanced touchscreen monitor, like the display found in Cat’s next-generation mini excavators and small loaders. It delivers advanced radio control and supports the 270-degree multicamera option. The advanced monitor pairs with the advanced joysticks for integrated control of all machine functions and adjustments.
“You can adjust the movement – or the aggressiveness or the conservativeness – of how your tracks and lift arms work through your advanced touchscreen display,” Dante Thomas, skid steer and CTL marketing manager, said. “And you can control of all of your display functions from the advanced joysticks. There are buttons with enter and select functions on those joysticks that you’re able to change any functionality that is possible.”
Cat also redesigned the entry, making the 255 and 265 easier to enter and exit. The cab door can be opened even when the lift arms are not fully lowered to the frame stops. It can be removed without tools in less than one minute.
Advanced technologies
Calling the 255 and 265 “one of the most attachment-friendly machines on the market,” Thomas says both the standard and advanced monitors can run Cat Smart Attachments, such as the dozer and grader blades and backhoe.
“It has attachment recognition that when you plug the attachment into the machine, it recognizes which attachment is connected. It adjusts your joystick pattern, so it gives you intuitive and simple control,” says Thomas.
The available Cat Product Link Elite system tracks machine hours, location, asset utilization, provides fault code details and delivers advanced monitoring and machine health, that is remotely accessible via VisionLink. In addition, Product Link Elite provides remote flash and troubleshooting capabilities and quickly enables the remote activation of the SEA High Flow feature.
[embedded content]

Quick Data is a snapshot of new and used wheel loader sales trends from Randall Reilly’s EDA equipment financing data, TopBid auction price service and EquipmentWatch market trend reports.
Demand for wheel loaders has softened with new and used financed wheel loader sales down year-over-year from August 1, 2022 to July 31, 2023 according to Randall Reilly’s EDA equipment financing data.
Financed new wheel loader sales dropped 10%, while used financed wheel loader sales fell by 15% compared to the same period last year.
Cat (22.4%), Deere (21.0%) and Komatsu (12.4%) held their positions year-over-year as the top three sellers of new financed wheel loaders. Top models sold included the Deere 544 P-Tier (401), Deere 624 P-Tier (380) and the Komatsu WA270-8 (364).
[Watch: “A Really Solid Machine” – Test Run of Komatsu’s WA475-10 Wheel Loader]
Cat (28.5%) and Deere (22.9%) also snagged the No. 1 and 2 positions for the highest number of financed used units sold, with Case (14.7%) claiming the third spot. On the date we examined the data, the top-selling models were the Case 321F (340), Cat 926M (164) and the Case 621G (159).
During this period, there were more buyers of new loaders in Florida (955) than in any other state. Buyers of new wheel loaders were also prevalent in Texas (893) and Illinois (665). Those states were also top buyers of used financed machines, with 712 units sold in Texas, 413 in Florida, and 412 in Illinois.
EDA data is compiled from state UCC-1 filings on financed construction equipment. EDA continually updates this data as information comes in from each state.
[Related Content: A Rundown of the Latest Wheel Loaders for 2023]
Used Wheel Loader Market
Used wheel loader prices rose 10.1% for the 12-month period from August 1, 2022 to July 31, 2023, according to Randall Reilly’s EquipmentWatch market trend data.
The average price for a used wheel loader was $137,465 in July 2022 compared to $151,367 in July 2023. The average age of used wheel loaders fell slightly during the period, dropping from 8.8 years to 8.3 years.
EquipmentWatchThe average age and price were calculated on 153,356 resale listings during the period in the EquipmentWatch database.
Over the last 12 months, prices for used wheel loaders have in general increased, with the largest gains in October 2022 (6.5%) and February 2023 (2.9%).
EquipmentWatch defines fair market value (FMV) as the monetary value of an asset that can be expected in a transaction with a single seller and single buyer, neither of whom is under any compulsion or time restriction to complete the transaction. FMV for heavy equipment is most closely associated with the private resale market, as opposed to the public auction market.
Wheel Loader Auction Prices
Caterpillar also dominated the auction charts, accounting for 18 of the top 20 wheel loaders sold in terms of price for the 12-month period of September 1, 2022 to August 31, 2023. Deere and Komatsu were the only other manufacturers to appear on the list.
The top auction price spot went to a 2021 Cat 966M with 2,188 hours. It sold for $400,000 at a Ritchie Bros. auction in Orlando, Fla., on September 21, 2022. The second-highest price paid was $315,000 for a 2019 Cat 980M with 7,836 hours at another Ritchie Bros. sale in Atlanta, on December 1, 2022. Rounding out the top three was a 2018 Deere 944K with 8,941 hours. It sold for $290,00 at a J.M. Wood Auction Co. sale in Montgomery, Ala., on March 21, 2023.
In total, there were 358 wheel loaders sold at auctions tracked by Top Bid during this time, with an average price of $99,747. (This does not include any units sold for less than $5,000.)
EDA, Top Bid and EquipmentWatch are owned by Randall Reilly, parent of Equipment World.
[Related Content: Heavy Equipment Auctions Set for Second Half of 2023]
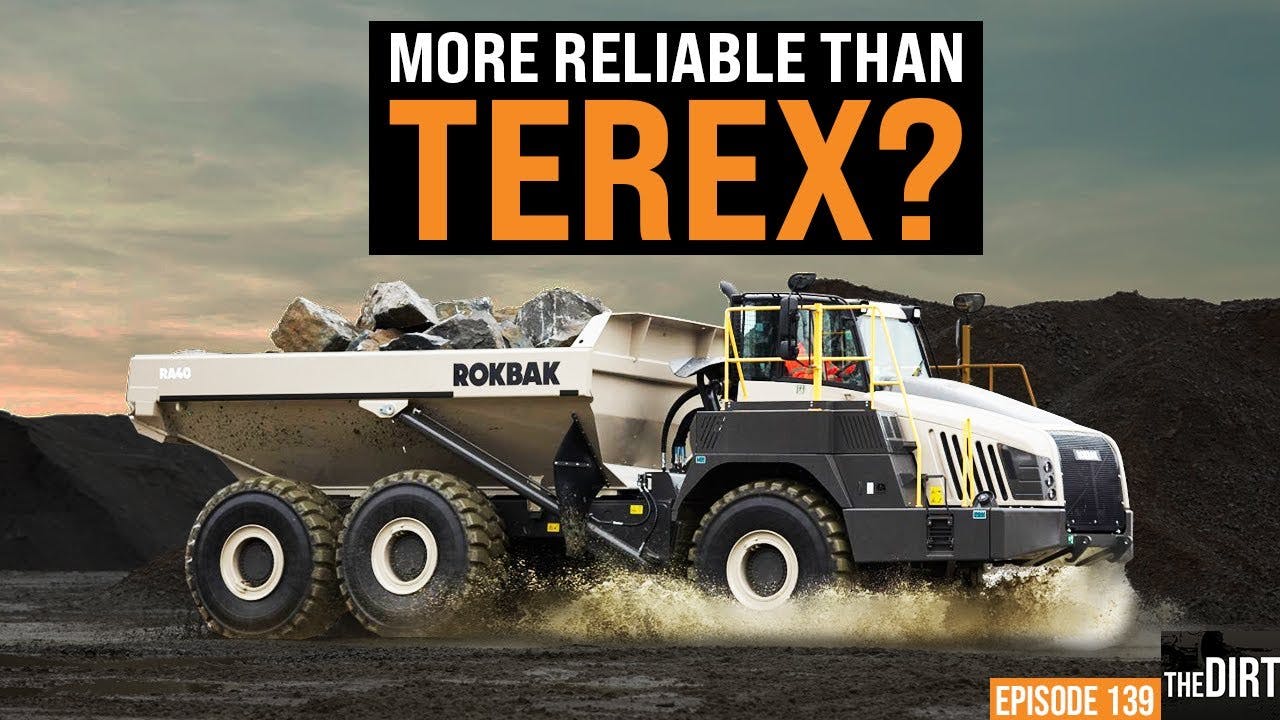
Volvo Construction Equipment bought Terex’s off-road truck line in 2014, and six years later, it rebranded its articulated haulers under the Rokbak name.
On this episode of The Dirt, we hear from Paul Douglas, Volvo vice president of rigid haulers, who explains the differences between the old Terex line and the Rokbak trucks. He also gives a hint at some of the new things coming from Rokbak, including redesigned cabs and replacing the current trucks with new models. There’s also the possibility of a new size truck to hit the market.
Rokbak, as with other construction equipment brands, is working toward a zero-emissions future. On this episode, he explains where the articulated dump truck market is heading in terms of alternative fuel. He adds that customers will see big changes in emissions and engines in the next five years, with the ultimate goal of reaching zero emissions within 10 years.
So to learn more about Rokbak and what the brand has in store for the future, check out this episode of The Dirt.
Equipment World serves up weekly videos on the latest in construction equipment, work trucks and pickup trucks – everything contractors need to get their work done. Subscribe and visit us at equipmentworld.com!
In This Episode:

-
Jobs2 years ago
Project Manager – Oxford
-
Jobs3 years ago
Commissioning Engineer Security Industry
-
Jobs2 years ago
Airport Retail Sales Assistants
-

 Business5 years ago
How To Renovate a Victorian House
-

 Business3 years ago
How to Get a Gold Supervisory CSCS Card
-
Jobs2 years ago
PASMA labourer in Cirencester
-

 Tech3 years ago
It Won’t Make You the $6 Million Man, But Hilti’s EXO-10 May Save Your Arms, Back
-
 Tech2 years ago
Komatsu launches new HD1500-8E0 rigid-frame dump truck