Business
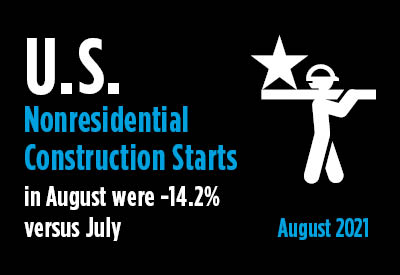
August’s Nonresidential Construction Starts -14% M/M, -11% Y/Y, & -6% YTD
High-Tech Giants Step to the Plate
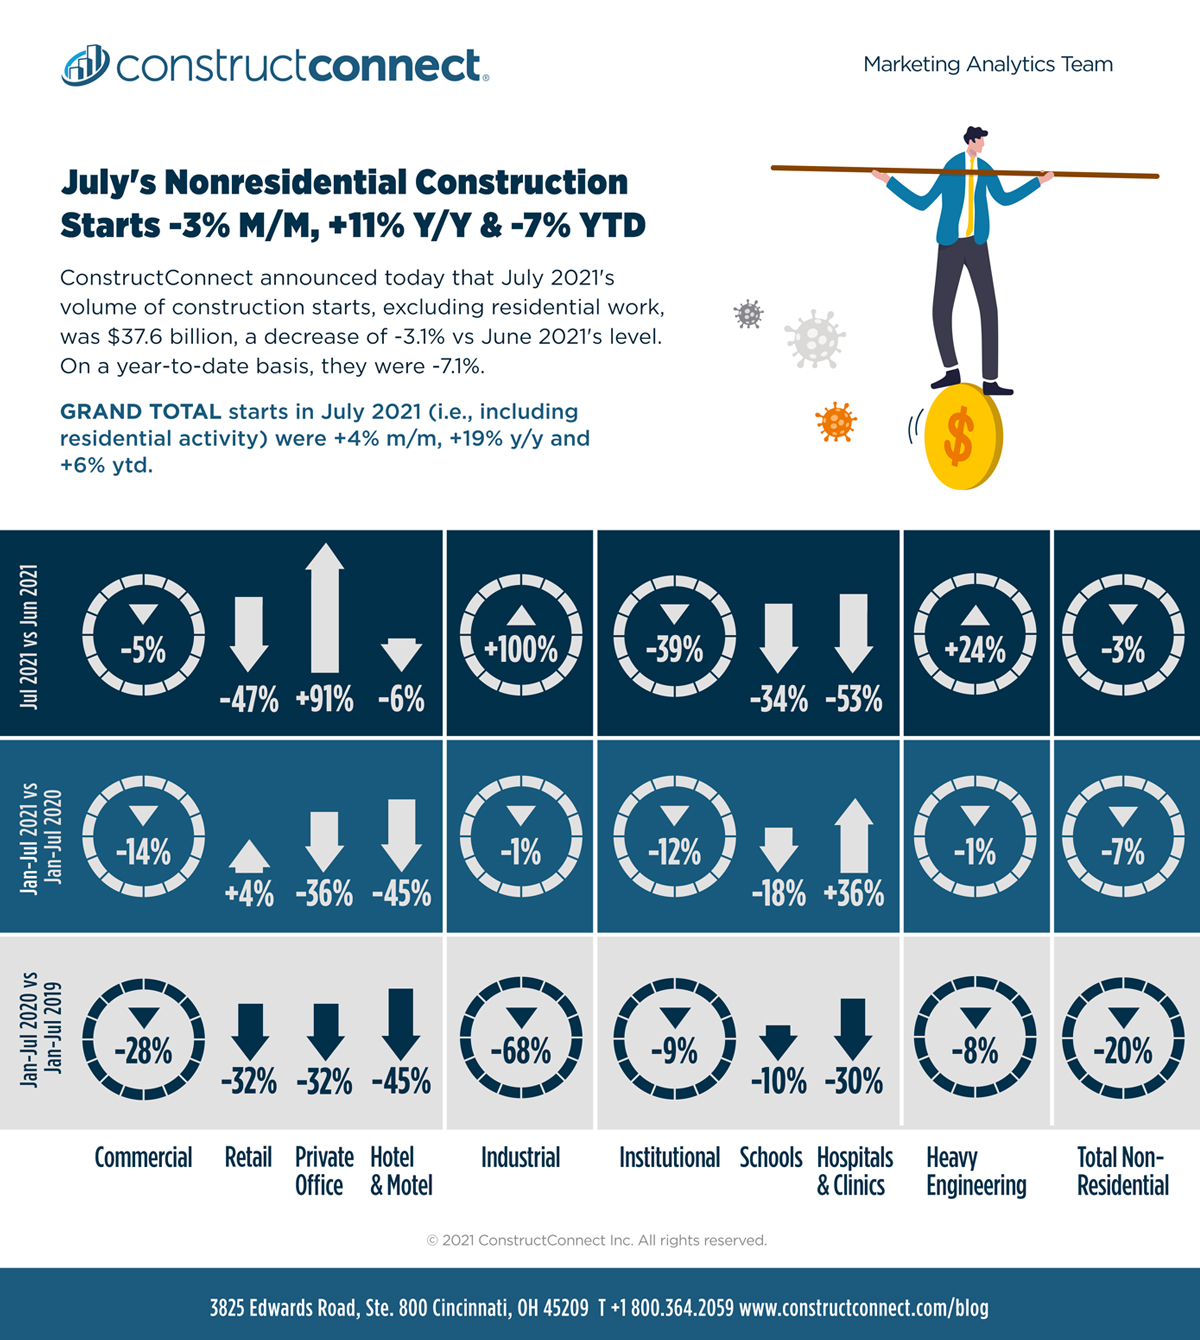
ConstructConnect announced today that August 2021’s volume of construction starts, excluding residential work, was $33.0 billion (see shaded green box, bottom of Table 8 below) a decrease of -14.2% vs July 2021’s level of $38.5 billion (originally reported as $37.6 billion).
Compared with August 2020, the latest month’s nonresidential starts were -11.1%. On a year-to-date basis, they were -6.4%. GRAND TOTAL starts in August 2021 (i.e., including residential activity) were -2.3% m/m, +4.5% y/y and +6.0% ytd.
View this information as an infographic.
Click here to download the complete Construction Industry Snapshot Package – August 2021 PDF.
Several of the biggest construction project initiations in the latest month were carried out by the high-tech giants. The ‘Top 10’ projects list (see Top 10 Project Starts in the U.S. – August 2021) of this report records go-aheads for two Facebook data centers, one in Mesa, Arizona and the other in Prineville, Oregon, plus a Google data center in Kansas City, Missouri. Among the next ten biggest project starts in August—in other words, projects that would have appeared if the list had been expanded to become a Top 20 list—were three Amazon fulfillment centers, in Pataskala, Ohio; Sioux Falls, South Dakota; and Rochester, New York. Each of the Amazon projects is projected to exceed a million square feet.
During the pandemic, low-rise light industrial and commercial building construction has flourished. Elaborating further there’s been strong owner support for data and distribution centers. Demand for new shopping malls, however, has been skimpy.
The standout project started in August of last year was the $2.3 billion motor vehicle battery plant in Warren, Ohio green-lighted by General Motors Corporation.
Three Divergent Construction Paths
Starts year to date in 2021, according to the three major type-of-structure categories, have diverged markedly. Residential starts have been ahead by a quarter, +24.6%; heavy engineering/civil starts have been flat, +0.8%; and nonresidential building starts have had trouble finding the light, -10.9%.
On a month-to-month basis in August, residential starts continued to forge ahead, +12.9%; engineering retreated significantly, -25.9%; and nonresidential building pulled back only a little, -3.5%.
Trailing 12-Month (TTM) Results on the Mend
Other statistics often beloved by analysts are trailing twelve-month (TTM) results and these are set out for all the various type-of-structure categories in Table 10 on page 11 of this report. Grand Total TTM starts in August on a month-to-month basis were +0.4%, compared with +1.0% in July and +0.8% in June. On a year-over-year basis in August, GT TTM starts were -1.7% versus -4.5% in July and -7.1% in June. These latest three y/y percent changes may still be negative, but the trend is moving in a healthier (less distressed) direction.
Even Split for Residential and Nonres in the PIP Stats
‘Starts’ compile the total estimated dollar value and square footage of all projects on which ground is broken in any given month. They lead, by nine months to as much as two years, put-in-place (PIP) statistics which are analogous to work-in-progress payments as the building of structures proceeds to completion.
PIP numbers cover the ‘universe’ of construction, new plus all manner of renovation activity, with residential traditionally making up two-fifths (about 40%) of the total and nonresidential, three-fifths (i.e., the bigger portion, at around 60%). Presently, though, according to the Census Bureau’s July 2021 not-seasonally-adjusted (NSA) PIP numbers for the total United States, the year-to-date mix has shifted dramatically. The residential to nonresidential relationship has become approximately half and half (i.e., 49.3%-to-50.7% respectively). The Census Bureau’s July 2021 NSA ytd PIP results are +6.2% for total; +25.3%, residential; and -7.5%, nonresidential (i.e., nonresidential buildings plus engineering).
PIP numbers, being more spread out, usually have smaller peak-over-trough percent-change amplitudes than the ‘starts’ series. As an additional valuable service for clients and powered by its extensive ‘starts’ database, ConstructConnect, in partnership with Oxford Economics, a world-leader in econometric modeling, has developed put-in-place construction statistics by types of structure for U.S. states, cities, and counties, ‘actuals’ and forecasts. ConstructConnect’s PIP numbers are being released quarterly and are featured in a separate reporting system.
Site Work Jobs Count has become Mired Down
Total employment by U.S. general and trade contractors was scaled back by -3,000 jobs in August. (The nominal change in U.S. total employment in August was +235,000.) The construction sector has added only +16,000 jobs in the current year, and that’s been thanks to March’s strong uptick of +93,000 jobs. Leave out March and the year-to-date sitework jobs figure deteriorates to -77,000. Nevertheless, the not seasonally adjusted (NSA) unemployment rate in construction in the latest month tightened to 4.6% from 6.1% in July. In August 2020, it had been 7.6%. (The U.S. ‘all jobs’ NSA unemployment rate is currently 5.2%.)
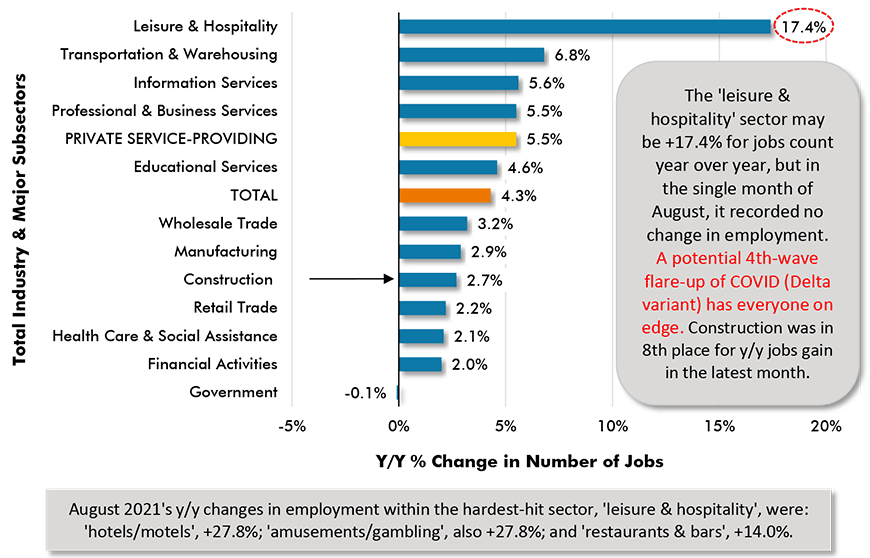
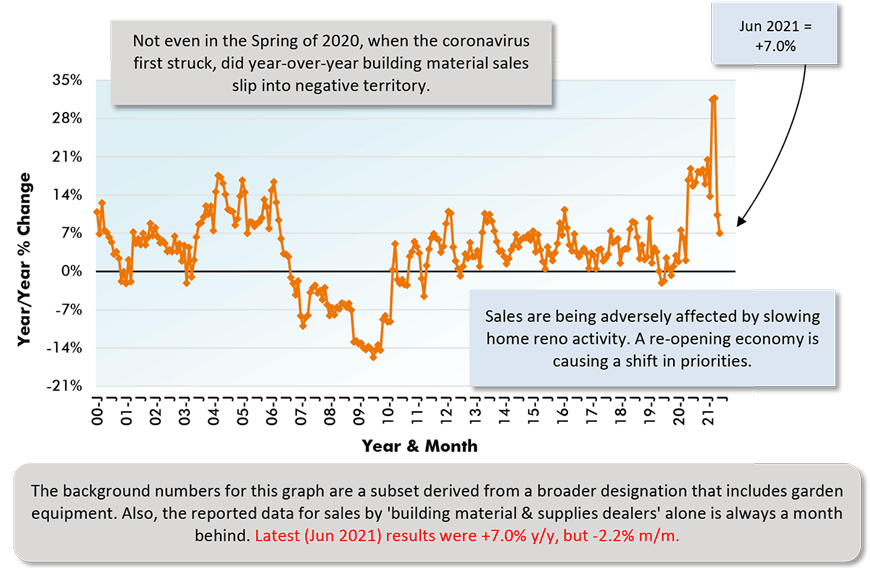
Construction currently ranks a lowly eighth among a dozen major industrial sectors for year-over-year jobs gain. Construction’s +2.7% places it just ahead of retail, at +2.2%, and a tad behind manufacturing, +2.9%. The leisure and hospitality sector has undertaken the greatest hiring spurt, +17.4% y/y. Other corners of the economy with close ties to construction have managed the following y/y increases in employment: architectural and engineering services, +5.3%; real estate firms, +5.0%; machinery and equipment rental and leasing, +4.8%; mining and logging, +3.1%; building material and supplies dealers, -0.8%; and cement and concrete product manufacturing, -2.3%. The +5.3% figure for project design firms augurs well for more construction crews being required in the field once authorizations to proceed are granted.
Graph 1: Change in Level of U.S. Construction Employment, Month to Month (M/M) −
Total & by Categories – August 2021
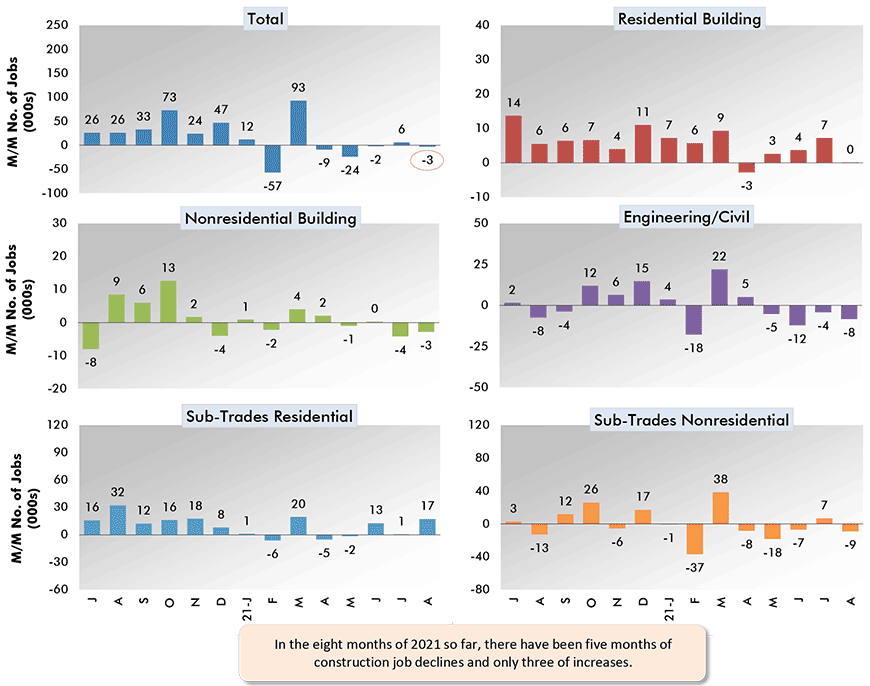
For each month, ‘net’ = zero. ‘Sub-trade’ in BLS data referred to as ‘specialty’ trade.
Data source: Bureau of Labor Statistics (BLS).
Chart: ConstructConnect.
Graph 2: U.S. Employment August 2021 – % Change Y/Y
Based on Seasonally Adjusted (SA) Data
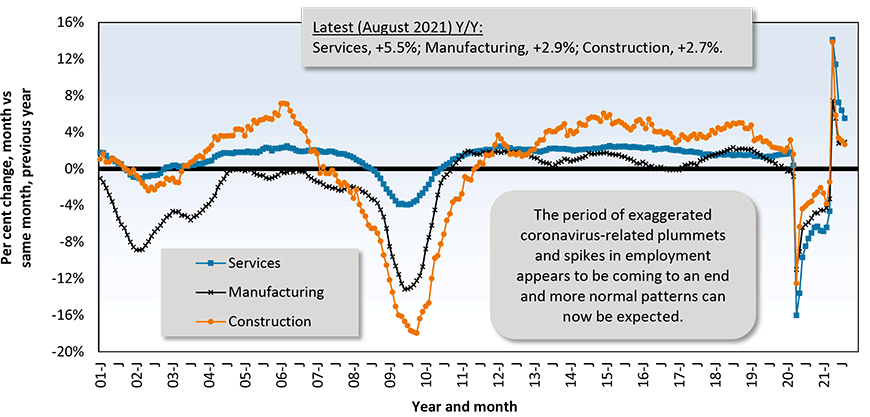
The latest data points are for August 2021.
Data source: Payroll Survey, Bureau of Labor Statistics (BLS).
Chart: ConstructConnect.
Graph 3: Y/Y Jobs Change, U.S. Total Industry & Major Subsectors − August 2021 (based on seasonally adjusted payroll data)
Data source: Payroll Survey, U.S. Bureau of Labor Statistics (Dept of Labor).
Chart: ConstructConnect.
Graph 4: Sales by U.S Building Material & Supplies Dealers
Data source: Census Bureau.
Chart: ConstructConnect.
Table 1: Monitoring the U.S. employment recovery ‒ August 2021
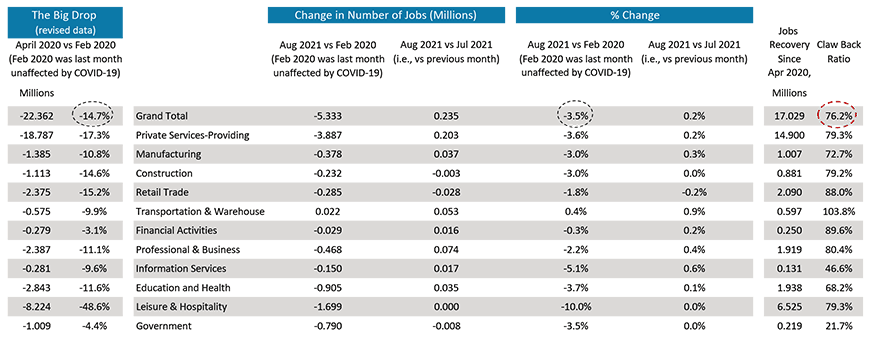
Data source: Bureau of Labor Statistics (BLS).
Chart: ConstructConnect.
Pluses and Minuses among the Type of Structure Subcategories
August’s -14.2% month-to-month (m/m) decline in total nonresidential starts resulted from drops of -57.4% in industrial and -25.9% in engineering. Commercial stayed about even, +0.9%, while institutional notched a slight win, +6.7%.
The -11.1% step back in August 2021’s total nonresidential starts versus August 2020 (y/y) was due to industrial taking a big tumble, -74.5%, and institutional and commercial also faltering, -12.5% and -10.1% respectively. Engineering made a modest gain, +7.3%.
The slide in total nonresidential starts year to date (Jan-Aug 2021/Jan-Aug 2020) of -6.4% owes its negative result to pullbacks of almost equal magnitude in industrial (-11.5%), commercial (-11.3%), and institutional (-11.2%), with engineering being slightly better than even (+0.8%).
There are two subcategories, that when added together, account for a smidge more than one-third of total nonresidential starts year to date, educational with a share of 16.3% and roads/highways with a share of 18.2%. The important time frame metrics for school starts in August were +10.4% m/m; but -1.3% y/y; and -15.1% ytd. Street starts were off by -26.5% m/m, but they were +14.3% y/y and +6.6% ytd.
The category with the third-largest share of total nonresidential starts ytd is ‘water/sewage’. It also suffered a setback m/m in August (-11.2%), but it showed well y/y (+16.1%) and ytd (+11.2%).
Medical facility starts, combining the three subcategories of hospitals/clinics, nursing/assisted living, and miscellaneous medical provided a 7.2% share of total nonresidential starts ytd in August. Groundbreakings in the combined health care category in the latest month were +9.0% m/m, -29.8% y/y and +0.4% ytd. Hospital/clinic starts on their own in August were +27.4% ytd.
Among other sub-categories of starts, good year-to-date performances have been turned in by retail/shopping (+8.1%), amusement (+12.8%), government offices (+24.3%), and miscellaneous commercial (+11.1%—see Coachella Valley arena in the Top 10 projects list). Poor year-to-date performances have been registered by hotels/motels (-42.3%), private offices (-32.3%), religious (-37.5%), bridges (-23.5%) and dam/marine work (-18.7%).
Table 2: Construction Starts in Some Additional Type of Structure Sub-Categories
| Jan-AUG 2021 | % Change vs | |
| ($ billions) | Jan-AUG 2020 | |
| Sports Stadiums/Convention Centers | $3.016 | -19.3% |
| Transportation Teminals | $2.925 | 81.5% |
| Courthouses | $1.688 | 42.0% |
| Police Stations & Fire Halls | $1.933 | -10.2% |
| Prisons | $1.483 | -12.6% |
| Pre-School/Elementary | $12.506 | -21.4% |
| Junior & Senior High Schools | $19.936 | -10.3% |
| K-12 (sum of above two categories) | $32.442 | -14.9% |
| Special & Vocational Schools | $1.201 | -18.3% |
| Colleges & Universities | $10.034 | -15.4% |
| Electric Power Infrastructure | $7.335 | 144.4% |
Data Source and Table: ConstructConnect.
JOLTS Numbers Boost Inflationary Expectations
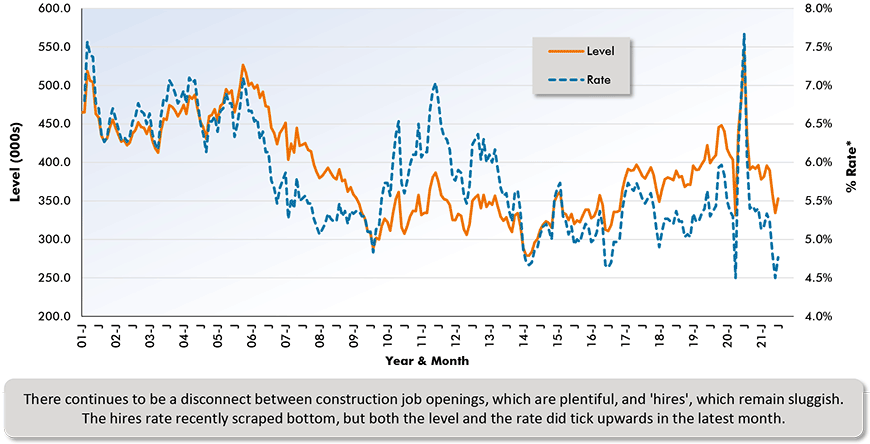
The monthly JOLTS statistics are exposing a glaring discrepancy. Job ‘openings’ in the construction sector, both as a level and a rate, are presently quite elevated, although they eased off in the latest month for which data is available, July. But ‘hires’, as a level and even more so as a rate, have descended markedly over most of the past little while, although they managed small upward jogs in July.
The problem of finding willing and qualified workers is cropping up in many sectors throughout the economy. Among the best tried and true answers to a labor shortage has always been to offer better wages. This adds one more underlying concern when assessing inflationary expectations.
Graph 5: U.S. Construction Job Openings (from JOLTS Report)
(3-month Moving Averages placed in Latest Month)
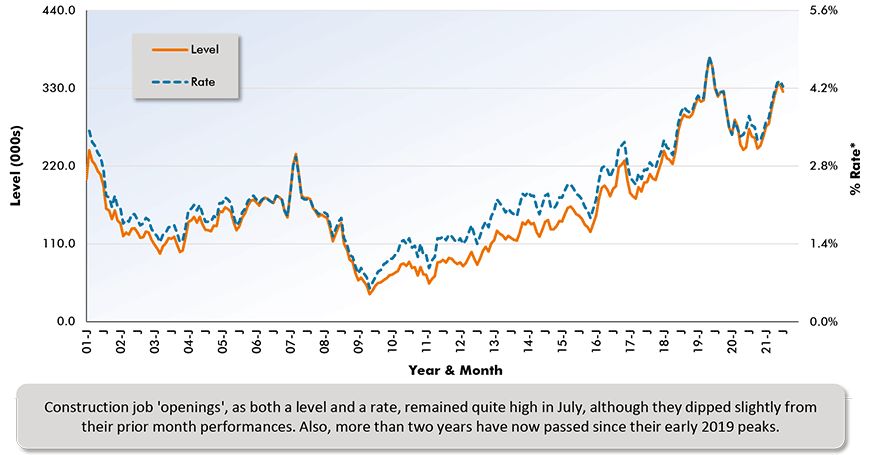
*Rate is number of job openings end-of-month as % of ‘construction employment plus number of job openings’.
Latest seasonally adjusted data points are for July 2021. … JOLTS = Job Openings and Labor Turnover Survey.
Data source: Bureau of Labor Statistics (BLS).
Chart: ConstructConnect.
Graph 6: U.S. Construction Job Hires (from JOLTS Report)
(3-month Moving Averages placed in Latest Month)
*Rate is number of job openings end-of-month as % of ‘construction employment plus number of job openings’.
Latest seasonally adjusted data points are for July 2021. … JOLTS = Job Openings and Labor Turnover Survey.
Data source: Bureau of Labor Statistics (BLS).
Chart: ConstructConnect.
A Wealth of Interesting Stories in Starts Trend Lines
The 12-month moving average trend graphs (Nonresidential Construction Starts Trend Graphs – August 2021) are telling interesting stories.
The descent in the nonresidential curve appears to have slowed considerably and heavy engineering is turning upwards. The institutional slide is continuing, but commercial’s tailspin is finally reversing.
The descent in private office buildings hasn’t relented, but after years of plummeting, retail has turned the corner. School/college starts, expressed as a trend line, are still in the doldrums. Hospitals/clinics, though, are moving sideways.
Roads/highways and water/sewage are heading upwards. Bridges, however, are on a downslope. Miscellaneous civil, after descending steeply (due to some mega projects dropping out of the 12-month moving average calculation), have moved into a holding pattern.
Y/Y Cost of Labor Wage Closing in on +5%
Tables B-3 and B-8 of the monthly Employment Situation report from the BLS record average hourly and average weekly wages for industry sectors. B-3 is for all employees (i.e., including bosses) on nonfarm payrolls. B-8 is for ‘production and non-supervisory personnel’ only (i.e., it excludes bosses). For ‘all jobs’ and construction, there are eight relevant percentage changes to consider.
From Table B3 (including bosses), ‘all jobs’ earnings y/y in August were +4.3% both hourly and weekly. For construction workers, as a subset of ‘all jobs,’ the compensation hikes were somewhat lower, but not by much, +3.9% hourly and +3.7% weekly. From Table B8 (excluding bosses), the ‘all jobs’ year-over-year earnings gains were +4.8% hourly and +5.4% weekly. Again, construction workers were left a little behind, +4.5% hourly, and +4.7% weekly.
There’s a significant takeaway from these compensation figures. Earlier during the past decade, wage increases, both generally and in construction, ranged between +2.0% and +3.0% y/y. They are now creeping towards +5.0% y/y. Lately, when considering the challenges facing the contracting community, there’s been a tendency to fixate on rising material costs. Also warranting a careful look, though, are rising charges for the other key input component, labor.
Graph 7: Average Hourly Earnings Y/Y – ‘All Jobs’ & Construction
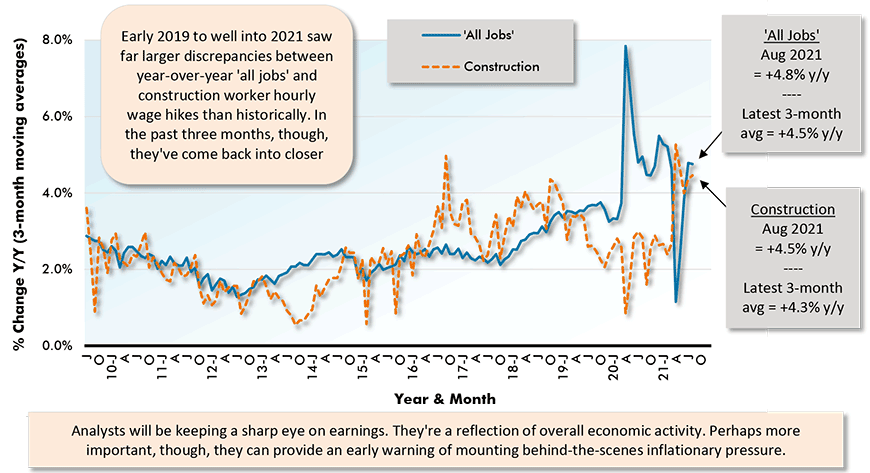
From ‘Production Workers and Non-supervisory Personnel’ Table (B8).
The latest data points are for August 2021
Data Source: Bureau of Labor Statistics (BLS)’s Employment Situation report.
Chart: ConstructConnect.
Graph 8: Average Weekly Earnings Y/Y – ‘All Jobs’ & Construction
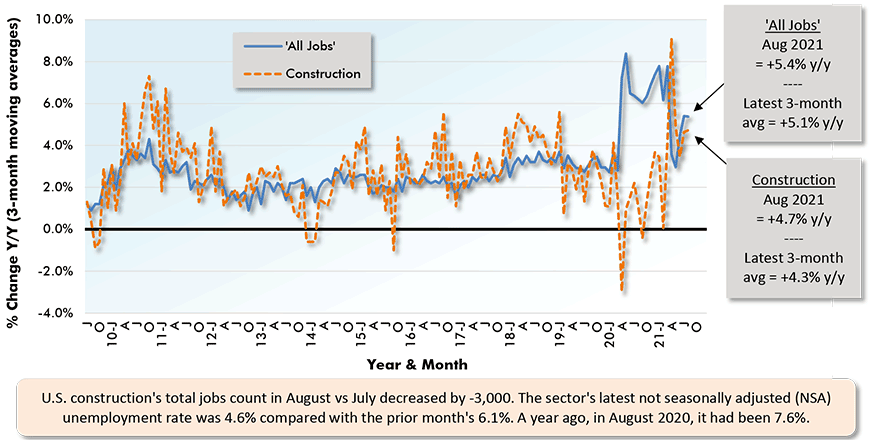
From ‘Production Workers and Nonsupervisory Personnel’ Table (B8).
The latest data points are for August 2021
Data Source: Bureau of Labor Statistics (BLS)’s Employment Situation report.
Chart: ConstructConnect.
Table 3: 2021 YTD Ranking of Top 20 States by $ Volume of Nonresidential Construction Starts – ConstructConnect
| Jan-AUG 2021 | % Change vs Jan-AUG 2020 | ||
| 1 | Texas | $32,264,339,105 | -5.9% |
| 2 | California | $23,273,084,894 | -15.2% |
| 3 | Florida | $15,527,201,089 | -2.3% |
| 4 | New York | $14,558,736,254 | 4.7% |
| 5 | Ohio | $10,262,825,266 | -11.6% |
| 6 | Pennsylvania | $9,451,559,782 | 29.0% |
| 7 | North Carolina | $8,951,907,524 | 24.1% |
| 8 | Illinois | $8,939,464,278 | -20.6% |
| 9 | Massachusetts | $8,593,616,299 | 22.8% |
| 10 | Georgia | $8,364,930,446 | -11.1% |
| 11 | Minnesota | $7,486,009,987 | 15.6% |
| 12 | Tennessee | $6,799,165,128 | 19.9% |
| 13 | Missouri | $6,773,389,232 | -9.1% |
| 14 | Michigan | $6,525,725,841 | 14.0% |
| 15 | Virginia | $6,337,808,322 | -19.5% |
| 16 | Washington | $5,721,659,702 | -48.3% |
| 17 | Arizona | $5,455,981,701 | -11.5% |
| 18 | Wisconsin | $5,316,485,037 | -24.6% |
| 19 | Indiana | $5,213,150,972 | -12.1% |
| 20 | Colorado | $5,181,292,940 | -4.0% |
Figures are comprised of non-res building & engineering (residential is omitted).
Data Source and Table: ConstructConnect.
Table 4: 2021 YTD Ranking of Top 20 States by $ Volume of Nonresidential Building Construction Starts – ConstructConnect
| Jan-AUG 2021 | % Change vs Jan-AUG 2020 | ||
| 1 | Texas | $18,672,229,026 | -18.5% |
| 2 | California | $13,063,579,760 | -7.4% |
| 3 | Florida | $9,613,241,227 | -7.7% |
| 4 | New York | $9,036,378,681 | -7.6% |
| 5 | North Carolina | $6,555,083,894 | 16.4% |
| 6 | Pennsylvania | $6,525,682,460 | 70.8% |
| 7 | Ohio | $6,251,244,382 | -19.3% |
| 8 | Georgia | $5,521,955,048 | -14.2% |
| 9 | Tennessee | $5,382,425,342 | 29.7% |
| 10 | Virginia | $4,522,447,724 | -5.3% |
| 11 | Arizona | $4,508,297,822 | -3.9% |
| 12 | Missouri | $4,490,484,541 | -20.7% |
| 13 | Illinois | $4,233,672,300 | -30.8% |
| 14 | Massachusetts | $3,821,745,607 | -26.0% |
| 15 | Washington | $3,567,211,527 | -25.1% |
| 16 | Alabama | $3,509,864,451 | 44.5% |
| 17 | Colorado | $3,316,505,655 | -6.9% |
| 18 | Maryland | $3,059,006,409 | -18.2% |
| 19 | Michigan | $2,856,436,093 | -13.9% |
| 20 | New Jersey | $2,840,012,643 | 7.0% |
Data Source and Table: ConstructConnect.
Table 5: 2021 YTD Ranking of Top 20 States by $ Volume of Heavy/Engineering Civil Construction Starts – ConstructConnect
| Jan-AUG 2021 | % Change vs Jan-AUG 2020 | ||
| 1 | Texas | $13,592,110,079 | 19.5% |
| 2 | California | $10,209,505,134 | -23.5% |
| 3 | Florida | $5,913,959,862 | 8.1% |
| 4 | New York | $5,522,357,573 | 33.8% |
| 5 | Minnesota | $5,451,842,973 | 59.1% |
| 6 | Massachusetts | $4,771,870,692 | 160.9% |
| 7 | Illinois | $4,705,791,978 | -8.5% |
| 8 | Ohio | $4,011,580,884 | 3.6% |
| 9 | Michigan | $3,669,289,748 | 52.4% |
| 10 | Pennsylvania | $2,925,877,322 | -16.6% |
| 11 | Wisconsin | $2,877,035,467 | 12.3% |
| 12 | Georgia | $2,842,975,398 | -4.4% |
| 13 | Indiana | $2,412,642,095 | -6.7% |
| 14 | North Carolina | $2,396,823,630 | 51.3% |
| 15 | Missouri | $2,282,904,691 | 28.0% |
| 16 | Washington | $2,154,448,175 | -65.8% |
| 17 | New Jersey | $2,136,808,473 | -15.2% |
| 18 | Iowa | $1,882,567,211 | -10.4% |
| 19 | Colorado | $1,864,787,285 | 1.5% |
| 20 | Maine | $1,821,080,242 | 120.0% |
Data Source and Table: ConstructConnect.
Lumber Prices Recede, Other Material Costs Skyrocket
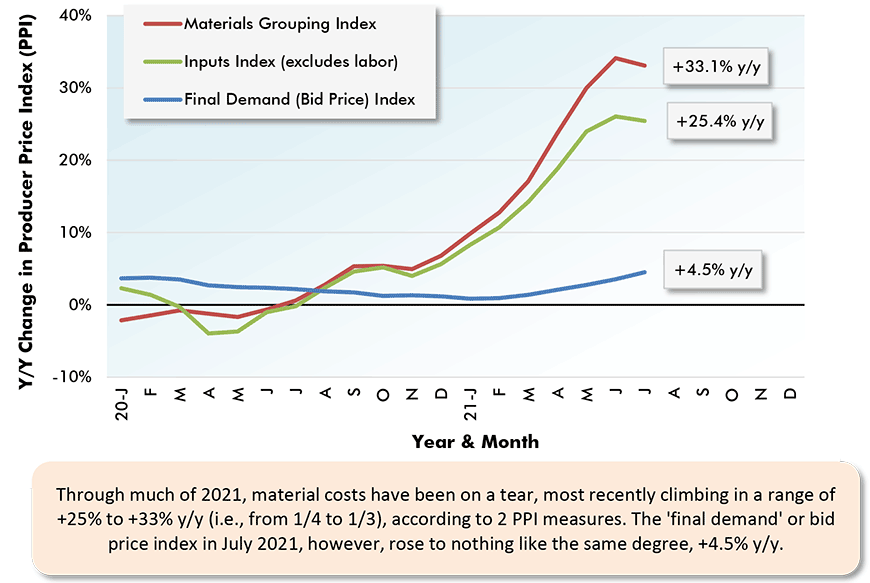
August 2021’s y/y results for three structures-related BLS Producer Price Index (PPI) series were as follows: ‘construction materials special index,’ +31.1% (an enormous increase, but not quite as high as July’s +33.1%); ‘inputs to new construction index, excluding capital investment, labor, and imports,’ +21.0% (again, a huge jump, but also a small step back from the previous month’s figure, +25.4%) and ‘final demand construction,’ designed to capture bid prices, +5.0% (a little more robust than July’s +4.5%).
Concerning the cost of some major construction material inputs, as revealed in the Producer Price Index (PPI) data set published by the Bureau of Labor Statistics (BLS), softwood lumber in August was -9.8% (it had been +154.3% just three months ago in May); hot rolled steel bars, plates, and structural shapes, +49.0% y/y; aluminum sheet and strip, +41.7%; copper wire and cable, +31.4%; and gypsum products, +22.9%.
The value of construction starts each month is derived from ConstructConnect’s database of all active construction projects in the United States. Missing project values are estimated with the help of RSMeans’ building cost models. ConstructConnect’s nonresidential construction starts series, because it is comprised of total-value estimates for individual projects, some of which are super-large, has a history of being more volatile than many other leading indicators for the economy.
Graph 9: U.S. Construction Bid Prices vs Material Input Costs – July 2021
Latest data points are for July 2021.
Chart: ConstructConnect.
Data source: Bureau of Labor Statistics, Producer Price Index data set.
Chart: ConstructConnect.
August 2021’s ‘Grand Total’ Starts +6.0% YTD
From Table 8 below, ConstructConnect’s total residential starts in August were +12.9% m/m, +25.9% y/y and +24.6% ytd. Multi-family starts are beginning to display some perkiness. In the latest month, they may have been -0.4% y/y, but they were +7.1% m/m and +6.4% ytd. Blazing the brightest trail, though, have been single-family starts, +14.4% m/m, +34.4% y/y and +31.9% ytd. Including home building with all nonresidential categories, Grand Total starts in August 2021 were -2.3% m/m, +4.5% y/y, and +6.0% ytd.
ConstructConnect adopts a research-assigned ‘start’ date. In concept, a ‘start’ is equivalent to ground being broken for a project to proceed. If work is abandoned or re-bid, the ‘start’ date is revised to reflect the new information.
Expansion Index Monitors Construction Prospects
The economy may be in recovery mode, but nonresidential work is usually a lagging player. Companies are hesitant to undertake capital spending until their personnel needs are rapidly expanding and their office square footage or plant footprints are straining capacity. Also, it helps if profits are abundant. (Today’s greater tendency to work from home has made office occupancy much more difficult to assess.)
Each month, ConstructConnect publishes information on upcoming construction projects at its Expansion Index.
The Expansion Index, for hundreds of cities in the United States and Canada, calculates the ratio, based on dollar volume, of projects in the planning stage, at present, divided by the comparable figure a year ago. The ratio moves above 1.0 when there is currently a larger dollar volume of construction ‘prospects’ than there was last year at the same time. The ratio sinks below 1.0 when the opposite is the case. The results are set out in interactive maps for both countries.
Click here to download the Construction Industry Snapshot Package – August 2021 PDF.
Click here for the Top 10 Project Starts in the U.S. – August 2021.
Click here for the Nonresidential Construction Starts Trend Graphs – August 2021.
TABLE 6: VALUE OF UNITED STATES NONRESIDENTIAL CONSTRUCTION STARTS
AUGUST 2021 – CONSTRUCTCONNECT
| % Change | % Change | % Change | ||||
| Jan-AUG 21 | Jan-AUG 21 vs | AUG 21 vs | AUG 21 vs | |||
| ($ billions) | Jan-AUG 20 | AUG 20 | JUL 21 | |||
| Hotel/Motel | 4.502 | -42.3% | -29.6% | -40.4% | ||
| Retail | 9.137 | 8.1% | 31.9% | 85.4% | ||
| Parking Garage | 1.261 | -1.2% | -12.9% | -9.7% | ||
| Amusement | 4.762 | 12.8% | 53.5% | -50.6% | ||
| Private Office | 11.722 | -32.3% | -29.7% | 37.2% | ||
| Government Office | 8.365 | 24.3% | 37.6% | -42.6% | ||
| Laboratory | 1.400 | -1.4% | 139.6% | 23.6% | ||
| Warehouse | 15.605 | -13.9% | -30.2% | 4.3% | ||
| Miscellaneous Commercial* | 5.941 | 11.1% | -10.8% | 112.9% | ||
| COMMERCIAL (big subset) | 62.695 | -11.3% | -10.1% | 0.9% | ||
| INDUSTRIAL (Manufacturing) | 12.955 | -11.5% | -74.5% | -57.4% | ||
| Religious | 0.651 | -37.5% | 38.3% | 299.7% | ||
| Hospital/Clinic | 11.106 | 27.4% | -35.9% | -19.5% | ||
| Nursing/Assisted Living | 3.973 | -19.5% | -34.7% | 95.6% | ||
| Library/Museum | 1.726 | -44.3% | -52.0% | -66.6% | ||
| Police/Courthouse/Prison | 5.104 | 1.3% | -36.6% | 2.6% | ||
| Military | 5.614 | -3.4% | -1.1% | -3.3% | ||
| School/College | 43.676 | -15.1% | -1.3% | 10.4% | ||
| Miscellaneous Medical | 4.192 | -24.3% | -10.6% | 19.8% | ||
| INSTITUTIONAL | 76.044 | -11.2% | -12.5% | 6.7% | ||
| Miscellaneous Nonresidential | 3.931 | 4.6% | -22.4% | -28.4% | ||
| NONRESIDENTIAL BUILDING | 155.625 | -10.9% | -20.6% | -3.5% | ||
| Airport | 3.888 | -4.6% | 12.4% | 43.0% | ||
| Road/Highway | 48.873 | 6.6% | 14.3% | -26.5% | ||
| Bridge | 13.036 | -23.5% | 24.5% | -5.0% | ||
| Dam/Marine | 4.462 | -18.7% | -3.1% | 35.9% | ||
| Water/Sewage | 23.949 | 11.2% | 16.1% | -11.2% | ||
| Miscellaneous Civil (power, pipelines, etc.) | 18.095 | 3.6% | -27.3% | -62.3% | ||
| HEAVY ENGINEERING (Civil) | 112.302 | 0.8% | 7.3% | -25.9% | ||
| TOTAL NONRESIDENTIAL | 267.927 | -6.4% | -11.1% | -14.2% |
*Includes transportation terminals and sports arenas.
Source: ConstructConnect Research Group and ConstructConnect.
Table: ConstructConnect.
TABLE 7: VALUE OF UNITED STATES CONSTRUCTION STARTS
CONSTRUCTCONNECT INSIGHT VERSION – JULY 2021
Arranged to match the alphabetical category drop-down menus in INSIGHT
| % Change | % Change | % Change | ||||||
| Jan-Aug 21 | Jan-Aug 21 vs | Aug 21 vs | Aug 21 vs | |||||
| ($ billions) | Jan-Aug 20 | Jul 20 | Jul 21 | |||||
| Summary | ||||||||
| CIVIL | 112.302 | 0.8% | 7.3% | -25.9% | ||||
| NONRESIDENTIAL BUILDING | 155.625 | -10.9% | -20.6% | -3.5% | ||||
| RESIDENTIAL | 238.201 | 24.6% | 25.9% | 12.9% | ||||
| GRAND TOTAL | 506.128 | 6.0% | 4.5% | -2.3% | ||||
| Verticals | ||||||||
| Airport | 3.888 | -4.6% | 12.4% | 43.0% | ||||
| All Other Civil | 10.759 | -25.6% | -18.4% | 14.9% | ||||
| Bridges | 13.036 | -23.5% | 24.5% | -5.0% | ||||
| Dams / Canals / Marine Work | 4.462 | -18.7% | -3.1% | 35.9% | ||||
| Power Infrastructure | 7.335 | 144.4% | -74.6% | -97.0% | ||||
| Roads | 48.873 | 6.6% | 14.3% | -26.5% | ||||
| Water and Sewage Treatment | 23.949 | 11.2% | 16.1% | -11.2% | ||||
| CIVIL | 112.302 | 0.8% | 7.3% | -25.9% | ||||
| Offices (private) | 11.722 | -32.3% | -29.7% | 37.2% | ||||
| Parking Garages | 1.261 | -1.2% | -12.9% | -9.7% | ||||
| Transportation Terminals | 2.925 | 81.5% | 31.2% | 26.5% | ||||
| Commercial (small subset) | 15.908 | -21.3% | -26.2% | 32.6% | ||||
| Amusement | 4.762 | 12.8% | 53.5% | -50.6% | ||||
| Libraries / Museums | 1.726 | -44.3% | -52.0% | -66.6% | ||||
| Religious | 0.651 | -37.5% | 38.3% | 299.7% | ||||
| Sports Arenas / Convention Centers | 3.016 | -19.3% | -24.9% | 255.4% | ||||
| Community | 10.155 | -16.1% | -1.8% | -24.4% | ||||
| College / University | 10.034 | -15.4% | 26.8% | 24.9% | ||||
| Elementary / Pre School | 12.506 | -21.4% | -19.1% | 6.4% | ||||
| Jr / Sr High School | 19.936 | -10.3% | -4.5% | 6.8% | ||||
| Special / Vocational | 1.201 | -18.3% | -18.2% | -25.5% | ||||
| Educational | 43.676 | -15.1% | -1.3% | 10.4% | ||||
| Courthouses | 1.688 | 42.0% | -36.1% | -67.7% | ||||
| Fire and Police Stations | 1.933 | -10.2% | -14.3% | 50.4% | ||||
| Government Offices | 8.365 | 24.3% | 37.6% | -42.6% | ||||
| Prisons | 1.483 | -12.6% | -49.8% | 108.7% | ||||
| Government | 13.469 | 14.5% | -1.6% | -32.5% | ||||
| Industrial Labs / Labs / School Labs | 1.400 | -1.4% | 139.6% | 23.6% | ||||
| Manufacturing | 12.955 | -11.5% | -74.5% | -57.4% | ||||
| Warehouses | 15.605 | -13.9% | -30.2% | 4.3% | ||||
| Industrial | 29.960 | -12.4% | -52.7% | -27.7% | ||||
| Hospitals / Clinics | 11.106 | 27.4% | -35.9% | -19.5% | ||||
| Medical Misc. | 4.192 | -24.3% | -10.6% | 19.8% | ||||
| Nursing Homes | 3.973 | -19.5% | -34.7% | 95.6% | ||||
| Medical | 19.272 | 0.4% | -29.8% | 9.0% | ||||
| Military | 5.614 | -3.4% | -1.1% | -3.3% | ||||
| Hotels | 4.502 | -42.3% | -29.6% | -40.4% | ||||
| Retail Misc. | 3.931 | 4.6% | -22.4% | -28.4% | ||||
| Shopping | 9.137 | 8.1% | 31.9% | 85.4% | ||||
| Retail | 17.570 | -12.2% | 3.5% | 12.6% | ||||
| NONRESIDENTIAL BUILDING | 155.625 | -10.9% | -20.6% | -3.5% | ||||
| Multi-Family | 57.751 | 6.4% | -0.4% | 7.1% | ||||
| Single-Family | 180.450 | 31.9% | 34.4% | 14.4% | ||||
| RESIDENTIAL | 238.201 | 24.6% | 25.9% | 12.9% | ||||
| NONRESIDENTIAL | 267.927 | -6.4% | -11.1% | -14.2% | ||||
| GRAND TOTAL | 506.128 | 6.0% | 4.5% | -2.3% | ||||
Table 2 conforms to the type-of-structure ordering adopted by many firms and organizations in the industry. Specifically, it breaks nonresidential building into ICI work (i.e., industrial, commercial, and institutional), since each has its own set of economic and demographic drivers. Table 3 presents an alternative, perhaps more user-friendly and intuitive type-of-structure ordering that matches how the data appears in ConstructConnect Insight.
Source: ConstructConnect.
Table: ConstructConnect.
TABLE 8: VALUE OF UNITED STATES NATIONAL CONSTRUCTION STARTS – JULY 2021 – CONSTRUCTCONNECT
Billions of current $s, not seasonally adjusted (NSA)
| Latest month actuals | Moving averages (placed in end month) | Year to Date. | |||||||||
| 3-months | 12-months | JAN-AUG | JAN-AUG | ||||||||
| JUN 21 | JUL 21 | AUG 21 | JUN 21 | JUL 21 | AUG 21 | JUN 21 | JUL 21 | AUG 21 | 2020 | 2021 | |
| Single Family | 25.650 | 24.114 | 27.580 | 23.614 | 24.244 | 25.781 | 21.037 | 21.321 | 21.909 | 136.836 | 180.450 |
| month-over-month % change | 11.7% | -6.0% | 14.4% | 3.2% | 2.7% | 6.3% | 2.8% | 1.4% | 2.8% | ||
| year-over-year % change | 36.2% | 16.5% | 34.4% | 49.0% | 34.0% | 28.8% | 28.1% | 28.3% | 30.0% | 2.6% | 31.9% |
| Apartment | 7.210 | 6.149 | 6.584 | 8.146 | 6.983 | 6.648 | 7.158 | 7.077 | 7.075 | 54.300 | 57.751 |
| month-over-month % change | -5.0% | -14.7% | 7.1% | 0.7% | -14.3% | -4.8% | -0.4% | -1.1% | 0.0% | ||
| year-over-year % change | -4.2% | -13.6% | -0.4% | 24.4% | -1.0% | -6.2% | -10.1% | -11.7% | -8.9% | -9.7% | 6.4% |
| TOTAL RESIDENTIAL | 32.860 | 30.263 | 34.164 | 31.760 | 31.227 | 32.429 | 28.195 | 28.398 | 28.984 | 191.136 | 238.201 |
| month-over-month % change | 7.5% | -7.9% | 12.9% | 2.5% | -1.7% | 3.9% | 2.0% | 0.7% | 2.1% | ||
| year-over-year % change | 24.7% | 8.8% | 25.9% | 41.8% | 24.2% | 19.6% | 15.6% | 15.3% | 17.7% | -1.2% | 24.6% |
| Hotel/Motel | 0.814 | 0.703 | 0.419 | 0.662 | 0.698 | 0.645 | 0.599 | 0.593 | 0.578 | 7.801 | 4.502 |
| month-over-month % change | 41.1% | -13.6% | -40.4% | 12.6% | 5.4% | -7.5% | 4.3% | -1.0% | -2.5% | ||
| year-over-year % change | 56.5% | -9.2% | -29.6% | 5.3% | 25.0% | 2.5% | -60.8% | -59.5% | -58.5% | -46.6% | -42.3% |
| Retail | 1.493 | 0.815 | 1.510 | 1.280 | 1.177 | 1.273 | 1.069 | 1.050 | 1.081 | 8.449 | 9.137 |
| month-over-month % change | 22.0% | -45.5% | 85.4% | 9.7% | -8.0% | 8.1% | 3.7% | -1.8% | 2.9% | ||
| year-over-year % change | 44.8% | -21.6% | 31.9% | 31.3% | 19.5% | 18.7% | -3.5% | -4.0% | 0.4% | -29.8% | 8.1% |
| Parking Garages | 0.114 | 0.177 | 0.160 | 0.097 | 0.138 | 0.151 | 0.139 | 0.146 | 0.144 | 1.276 | 1.261 |
| month-over-month % change | -6.8% | 55.7% | -9.7% | -14.8% | 42.5% | 9.2% | -0.5% | 4.7% | -1.4% | ||
| year-over-year % change | -6.6% | 78.6% | -12.9% | -27.8% | -3.5% | 11.5% | -28.7% | -16.2% | -15.6% | -46.8% | -1.2% |
| Amusement | 0.674 | 1.131 | 0.559 | 0.531 | 0.776 | 0.788 | 0.491 | 0.554 | 0.570 | 4.222 | 4.762 |
| month-over-month % change | 28.9% | 67.9% | -50.6% | 3.8% | 46.2% | 1.5% | 2.3% | 12.8% | 2.9% | ||
| year-over-year % change | 24.1% | 199.2% | 53.5% | -0.3% | 77.5% | 83.9% | -22.9% | -2.3% | 2.5% | -17.9% | 12.8% |
| Office | 0.847 | 1.887 | 2.589 | 1.084 | 1.254 | 1.774 | 1.727 | 1.774 | 1.683 | 17.321 | 11.722 |
| month-over-month % change | -17.7% | 122.8% | 37.2% | -16.0% | 15.7% | 41.5% | -4.0% | 2.7% | -5.1% | ||
| year-over-year % change | -50.5% | 43.1% | -29.7% | -31.5% | -8.9% | -20.7% | -36.0% | -29.7% | -35.7% | -22.9% | -32.3% |
| Governmental Offices | 0.796 | 2.140 | 1.228 | 0.902 | 1.306 | 1.388 | 0.890 | 0.997 | 1.025 | 6.731 | 8.365 |
| month-over-month % change | -19.0% | 168.9% | -42.6% | -3.4% | 44.8% | 6.3% | -1.0% | 12.1% | 2.8% | ||
| year-over-year % change | -11.9% | 151.9% | 37.6% | 8.2% | 59.4% | 57.4% | -9.3% | 9.8% | 16.0% | -14.5% | 24.3% |
| Laboratories | 0.179 | 0.236 | 0.292 | 0.137 | 0.182 | 0.236 | 0.169 | 0.176 | 0.191 | 1.420 | 1.400 |
| month-over-month % change | 38.6% | 31.7% | 23.6% | -12.9% | 32.3% | 29.8% | -2.2% | 4.6% | 8.0% | ||
| year-over-year % change | -20.2% | 64.3% | 139.6% | 10.4% | 22.9% | 44.3% | -21.1% | -18.9% | -1.9% | -5.6% | -1.4% |
| Warehouse | 1.929 | 1.575 | 1.642 | 2.350 | 1.831 | 1.715 | 2.044 | 2.024 | 1.964 | 18.131 | 15.605 |
| month-over-month % change | -2.9% | -18.3% | 4.3% | -7.1% | -22.1% | -6.3% | -3.4% | -1.0% | -2.9% | ||
| year-over-year % change | -30.8% | -13.5% | -30.2% | -8.6% | -20.6% | -26.1% | -3.8% | -5.8% | -7.6% | 19.4% | -13.9% |
| Misc Commercial | 2.573 | 0.303 | 0.645 | 1.184 | 1.089 | 1.173 | 0.683 | 0.629 | 0.622 | 5.348 | 5.941 |
| month-over-month % change | 556.6% | -88.2% | 112.9% | 88.0% | -8.0% | 7.7% | 32.9% | -7.9% | -1.0% | ||
| year-over-year % change | 374.0% | -68.2% | -10.8% | 118.8% | 63.9% | 58.7% | -41.9% | -38.6% | -37.9% | -61.6% | 11.1% |
| TOTAL COMMERCIAL | 9.419 | 8.968 | 9.045 | 8.228 | 8.451 | 9.144 | 7.811 | 7.944 | 7.859 | 70.699 | 62.695 |
| month-over-month % change | 35.2% | -4.8% | 0.9% | 3.9% | 2.7% | 8.2% | 1.1% | 1.7% | -1.1% | ||
| year-over-year % change | 12.4% | 21.6% | -10.1% | 3.9% | 13.6% | 6.2% | -26.7% | -21.5% | -21.6% | -25.7% | -11.3% |
| TOTAL INDUSTRIAL (Manufacturing) | 1.115 | 2.097 | 0.892 | 1.431 | 1.728 | 1.368 | 1.796 | 1.876 | 1.659 | 14.638 | 12.955 |
| month-over-month % change | -43.5% | 88.0% | -57.4% | -34.5% | 20.7% | -20.8% | 1.5% | 4.5% | -11.6% | ||
| year-over-year % change | 38.8% | 85.1% | -74.5% | -15.3% | 14.0% | -24.5% | -44.5% | -29.4% | -13.4% | -69.2% | -11.5% |
| Religious | 0.085 | 0.037 | 0.148 | 0.085 | 0.069 | 0.090 | 0.105 | 0.100 | 0.104 | 1.043 | 0.651 |
| month-over-month % change | -0.1% | -56.1% | 299.7% | -9.2% | -18.6% | 30.9% | -3.1% | -4.2% | 3.4% | ||
| year-over-year % change | -32.4% | -58.8% | 38.3% | -20.6% | -39.0% | -16.3% | -26.8% | -27.8% | -22.9% | -20.8% | -37.5% |
| Hosptials/Clinics | 1.875 | 0.965 | 0.776 | 1.156 | 1.131 | 1.205 | 1.360 | 1.345 | 1.309 | 8.715 | 11.106 |
| month-over-month % change | 239.2% | -48.5% | -19.5% | -36.8% | -2.2% | 6.6% | 5.4% | -1.1% | -2.7% | ||
| year-over-year % change | 80.2% | -15.5% | -35.9% | 14.2% | 1.8% | 6.6% | -20.2% | -13.3% | -10.2% | -33.0% | 27.4% |
| Nursing/Assisted Living | 0.826 | 0.264 | 0.516 | 0.628 | 0.553 | 0.536 | 0.577 | 0.566 | 0.543 | 4.934 | 3.973 |
| month-over-month % change | 45.4% | -68.0% | 95.6% | 11.2% | -11.9% | -3.1% | 3.1% | -1.9% | -4.0% | ||
| year-over-year % change | 33.2% | -33.1% | -34.7% | 7.2% | 11.5% | -11.0% | -13.1% | -11.6% | -19.3% | -23.6% | -19.5% |
| Libraries/Museums | 0.229 | 0.341 | 0.114 | 0.226 | 0.306 | 0.228 | 0.195 | 0.204 | 0.194 | 3.097 | 1.726 |
| month-over-month % change | -34.3% | 48.6% | -66.6% | -1.8% | 35.3% | -25.6% | -3.9% | 4.8% | -5.0% | ||
| year-over-year % change | -29.5% | 48.5% | -52.0% | -27.6% | 2.7% | -13.7% | -51.5% | -46.5% | -50.5% | 25.5% | -44.3% |
| Police/Courthouse/Prison | 0.878 | 0.619 | 0.635 | 0.668 | 0.674 | 0.711 | 0.708 | 0.710 | 0.679 | 5.038 | 5.104 |
| month-over-month % change | 67.5% | -29.5% | 2.6% | 26.5% | 0.8% | 5.5% | 4.5% | 0.2% | -4.3% | ||
| year-over-year % change | 71.7% | 3.0% | -36.6% | 43.1% | 33.2% | 0.8% | 16.1% | 13.5% | 3.3% | 23.4% | 1.3% |
| Military | 1.248 | 0.645 | 0.624 | 0.741 | 0.873 | 0.839 | 0.748 | 0.752 | 0.752 | 5.811 | 5.614 |
| month-over-month % change | 71.6% | -48.3% | -3.3% | 16.6% | 17.9% | -3.9% | 7.1% | 0.6% | -0.1% | ||
| year-over-year % change | 90.2% | 8.8% | -1.1% | -28.5% | 50.3% | 33.9% | 13.7% | 11.0% | 7.0% | 139.0% | -3.4% |
| Schools/Colleges | 7.739 | 5.185 | 5.725 | 6.701 | 6.442 | 6.216 | 5.074 | 4.981 | 4.975 | 51.465 | 43.676 |
| month-over-month % change | 20.9% | -33.0% | 10.4% | 19.3% | -3.9% | -3.5% | -3.0% | -1.8% | -0.1% | ||
| year-over-year % change | -19.5% | -17.7% | -1.3% | -13.2% | -16.8% | -14.1% | -14.3% | -15.3% | -15.3% | -9.5% | -15.1% |
| Misc Government | 0.728 | 0.438 | 0.524 | 0.616 | 0.541 | 0.563 | 0.607 | 0.576 | 0.571 | 5.538 | 4.192 |
| month-over-month % change | 59.0% | -39.9% | 19.8% | 18.5% | -12.1% | 4.1% | 3.7% | -5.1% | -0.9% | ||
| year-over-year % change | 55.4% | -46.0% | -10.6% | -2.4% | -23.6% | -9.4% | -14.0% | -20.3% | -18.8% | -14.0% | -24.3% |
| TOTAL INSTITUTIONAL | 13.608 | 8.493 | 9.063 | 10.819 | 10.588 | 10.388 | 9.374 | 9.235 | 9.127 | 85.639 | 76.044 |
| month-over-month % change | 40.8% | -37.6% | 6.7% | 8.0% | -2.1% | -1.9% | 0.2% | -1.5% | -1.2% | ||
| year-over-year % change | 1.8% | -16.4% | -12.5% | -8.9% | -8.4% | -8.0% | -13.3% | -13.0% | -13.9% | -8.0% | -11.2% |
| Misc Non Residential | 0.443 | 0.538 | 0.385 | 0.525 | 0.541 | 0.455 | 0.490 | 0.503 | 0.493 | 3.757 | 3.931 |
| month-over-month % change | -30.9% | 21.2% | -28.4% | -2.2% | 3.1% | -15.9% | -1.6% | 2.6% | -1.8% | ||
| year-over-year % change | -17.8% | 39.3% | -22.4% | 15.0% | 20.9% | -3.9% | -16.9% | -12.1% | -12.3% | -19.6% | 4.6% |
| TOTAL NONRES BUILDING | 24.585 | 20.095 | 19.385 | 21.003 | 21.308 | 21.355 | 19.470 | 19.557 | 19.138 | 174.733 | 155.625 |
| month-over-month % change | 27.8% | -18.3% | -3.5% | 1.7% | 1.5% | 0.2% | 0.6% | 0.4% | -2.1% | ||
| year-over-year % change | 6.5% | 5.5% | -20.6% | -4.3% | 1.7% | -3.8% | -23.0% | -18.4% | -17.1% | -27.3% | -10.9% |
| Airports | 0.823 | 0.568 | 0.811 | 0.661 | 0.715 | 0.734 | 0.489 | 0.479 | 0.487 | 4.076 | 3.888 |
| month-over-month % change | 8.9% | -31.1% | 43.0% | 45.7% | 8.3% | 2.6% | -1.1% | -2.0% | 1.6% | ||
| year-over-year % change | -7.6% | -17.0% | 12.4% | 13.9% | 1.3% | -4.1% | -12.9% | -9.8% | -9.0% | -19.3% | -4.6% |
| Roads/Highways | 6.802 | 8.104 | 5.959 | 7.228 | 7.545 | 6.955 | 5.309 | 5.491 | 5.553 | 45.851 | 48.873 |
| month-over-month % change | -12.0% | 19.1% | -26.5% | 4.0% | 4.4% | -7.8% | -0.5% | 3.4% | 1.1% | ||
| year-over-year % change | -4.2% | 37.0% | 14.3% | 0.6% | 14.2% | 14.4% | -3.9% | 2.4% | 4.0% | -2.6% | 6.6% |
| Bridges | 1.546 | 1.493 | 1.419 | 1.735 | 1.566 | 1.486 | 1.594 | 1.539 | 1.563 | 17.045 | 13.036 |
| month-over-month % change | -6.9% | -3.4% | -5.0% | -3.5% | -9.7% | -5.1% | -6.8% | -3.4% | 1.5% | ||
| year-over-year % change | -47.4% | -30.3% | 24.5% | -22.8% | -33.7% | -28.4% | -27.7% | -30.5% | -26.9% | -21.0% | -23.5% |
| Dams/Marine | 0.659 | 0.575 | 0.781 | 0.567 | 0.569 | 0.672 | 0.604 | 0.607 | 0.605 | 5.489 | 4.462 |
| month-over-month % change | 39.4% | -12.9% | 35.9% | 8.0% | 0.4% | 18.0% | -0.2% | 0.5% | -0.3% | ||
| year-over-year % change | -2.3% | 6.6% | -3.1% | -24.8% | -17.9% | -0.2% | -11.4% | -10.8% | -14.8% | -0.5% | -18.7% |
| Water/Sewage | 3.293 | 3.498 | 3.108 | 3.188 | 3.489 | 3.300 | 2.717 | 2.768 | 2.803 | 21.530 | 23.949 |
| month-over-month % change | -10.4% | 6.2% | -11.2% | 6.2% | 9.4% | -5.4% | -0.5% | 1.9% | 1.3% | ||
| year-over-year % change | -4.5% | 20.9% | 16.1% | 10.6% | 22.1% | 9.8% | 2.2% | 4.6% | 4.0% | 3.5% | 11.2% |
| Misc Civil | 1.710 | 4.200 | 1.584 | 1.763 | 2.356 | 2.498 | 1.852 | 1.989 | 1.940 | 17.471 | 18.095 |
| month-over-month % change | 47.9% | 145.6% | -62.3% | 2.0% | 33.7% | 6.0% | -1.4% | 7.4% | -2.5% | ||
| year-over-year % change | -15.3% | 64.6% | -27.3% | -25.1% | -15.5% | 11.0% | -47.8% | -45.3% | -35.6% | -36.5% | 3.6% |
| TOTAL ENGINEERING | 14.834 | 18.438 | 13.662 | 15.141 | 16.240 | 15.645 | 12.564 | 12.873 | 12.950 | 111.462 | 112.302 |
| month-over-month % change | -4.0% | 24.3% | -25.9% | 4.7% | 7.3% | -3.7% | -1.5% | 2.5% | 0.6% | ||
| year-over-year % change | -13.1% | 25.2% | 7.3% | -5.4% | 1.4% | 5.4% | -17.2% | -14.6% | -10.2% | -12.6% | 0.8% |
| GRAND TOTAL | 72.278 | 68.796 | 67.211 | 67.904 | 68.775 | 69.429 | 60.229 | 60.829 | 61.072 | 477.330 | 506.128 |
| month-over-month % change | 10.8% | -4.8% | -2.3% | 2.8% | 1.3% | 1.0% | 0.8% | 1.0% | 0.4% | ||
| year-over-year % change | 8.7% | 11.7% | 4.5% | 12.5% | 10.7% | 8.2% | -7.1% | -4.5% | -1.7% | -15.0% | 6.0% |
| NONRES BLDG + ENGINEERING | 39.419 | 38.533 | 33.047 | 36.143 | 37.548 | 37.000 | 32.034 | 32.430 | 32.088 | 286.195 | 267.927 |
| month-over-month % change | 13.6% | -2.2% | -14.2% | 2.9% | 3.9% | -1.5% | -0.2% | 1.2% | -1.1% | ||
| year-over-year % change | -1.9% | 14.1% | -11.1% | -4.7% | 1.6% | -0.1% | -20.9% | -16.9% | -14.5% | -22.2% | -6.4% |
Data Source and Table: ConstructConnect.
TABLE 9: U.S. YEAR-TO-DATE REGIONAL STARTS,
NONRESIDENTIAL CONSTRUCTION* — CONSTRUCTCONNECT
| JAN-AUG 2020 | JAN-AUG 2021 | % Change | |||
| Connecticut | $2,843,650,515 | $1,996,933,100 | -29.8% | ||
| Maine | $1,288,684,345 | $2,409,156,193 | 86.9% | ||
| Massachusetts | $6,995,413,539 | $8,593,616,299 | 22.8% | ||
| New Hampshire | $741,164,746 | $1,009,945,714 | 36.3% | ||
| Rhode Island | $593,660,957 | $685,893,568 | 15.5% | ||
| Vermont | $455,333,478 | $305,297,293 | -33.0% | ||
| Total New England | $12,917,907,580 | $15,000,842,167 | 16.1% | ||
| New Jersey | $5,173,329,302 | $4,976,821,116 | -3.8% | ||
| New York | $13,904,106,268 | $14,558,736,254 | 4.7% | ||
| Pennsylvania | $7,326,290,112 | $9,451,559,782 | 29.0% | ||
| Total Middle Atlantic | $26,403,725,682 | $28,987,117,152 | 9.8% | ||
| TOTAL NORTHEAST | $39,321,633,262 | $43,987,959,319 | 11.9% | ||
| Illinois | $11,262,666,670 | $8,939,464,278 | -20.6% | ||
| Indiana | $5,933,823,807 | $5,213,150,972 | -12.1% | ||
| Michigan | $5,725,881,574 | $6,525,725,841 | 14.0% | ||
| Ohio | $11,615,876,332 | $10,262,825,266 | -11.6% | ||
| Wisconsin | $7,055,419,041 | $5,316,485,037 | -24.6% | ||
| Total East North Central | $41,593,667,424 | $36,257,651,394 | -12.8% | ||
| Iowa | $3,889,446,678 | $3,861,445,843 | -0.7% | ||
| Kansas | $3,416,439,119 | $2,120,682,054 | -37.9% | ||
| Minnesota | $6,476,503,133 | $7,486,009,987 | 15.6% | ||
| Missouri | $7,449,229,681 | $6,773,389,232 | -9.1% | ||
| Nebraska | $3,396,863,519 | $2,648,488,493 | -22.0% | ||
| North Dakota | $1,974,228,655 | $1,702,204,011 | -13.8% | ||
| South Dakota | $886,155,715 | $1,480,383,960 | 67.1% | ||
| Total West North Central | $27,488,866,500 | $26,072,603,580 | -5.2% | ||
| TOTAL MIDWEST | $69,082,533,924 | $62,330,254,974 | -9.8% | ||
| Delaware | $1,296,104,341 | $766,361,515 | -40.9% | ||
| District of Columbia | $636,612,002 | $682,664,032 | 7.2% | ||
| Florida | $15,885,653,482 | $15,527,201,089 | -2.3% | ||
| Georgia | $9,409,376,502 | $8,364,930,446 | -11.1% | ||
| Maryland | $4,921,936,313 | $3,865,890,056 | -21.5% | ||
| North Carolina | $7,215,567,991 | $8,951,907,524 | 24.1% | ||
| South Carolina | $3,819,474,356 | $3,669,395,030 | -3.9% | ||
| Virginia | $7,877,815,597 | $6,337,808,322 | -19.5% | ||
| West Virginia | $1,844,905,885 | $789,472,420 | -57.2% | ||
| Total South Atlantic | $52,907,446,469 | $48,955,630,434 | -7.5% | ||
| Alabama | $3,556,945,608 | $4,890,473,014 | 37.5% | ||
| Kentucky | $2,356,373,956 | $2,470,456,863 | 4.8% | ||
| Mississippi | $2,132,587,952 | $1,542,281,369 | -27.7% | ||
| Tennessee | $5,671,920,370 | $6,799,165,128 | 19.9% | ||
| Total East South Central | $13,717,827,886 | $15,702,376,374 | 14.5% | ||
| Arkansas | $2,846,558,338 | $1,758,780,121 | -38.2% | ||
| Louisiana | $3,289,145,370 | $3,583,354,125 | 8.9% | ||
| Oklahoma | $2,849,326,968 | $3,033,835,353 | 6.5% | ||
| Texas | $34,274,870,141 | $32,264,339,105 | -5.9% | ||
| Total West South Central | $43,259,900,817 | $40,640,308,704 | -6.1% | ||
| TOTAL SOUTH | $109,885,175,172 | $105,298,315,512 | -4.2% | ||
| Arizona | $6,161,545,716 | $5,455,981,701 | -11.5% | ||
| Colorado | $5,398,025,209 | $5,181,292,940 | -4.0% | ||
| Idaho | $1,075,828,374 | $907,837,325 | -15.6% | ||
| Montana | $1,172,487,166 | $769,137,213 | -34.4% | ||
| Nevada | $2,945,088,295 | $2,914,755,884 | -1.0% | ||
| New Mexico | $1,413,349,360 | $1,361,256,962 | -3.7% | ||
| Utah | $5,100,107,689 | $3,625,941,498 | -28.9% | ||
| Wyoming | $730,323,398 | $749,524,350 | 2.6% | ||
| Total Mountain | $23,996,755,207 | $20,965,727,873 | -12.6% | ||
| Alaska | $951,801,177 | $851,896,167 | -10.5% | ||
| California | $27,453,741,184 | $23,273,084,894 | -15.2% | ||
| Hawaii | $1,388,978,162 | $1,433,894,070 | 3.2% | ||
| Oregon | $3,048,903,264 | $4,063,864,612 | 33.3% | ||
| Washington | $11,065,058,104 | $5,721,659,702 | -48.3% | ||
| Total Pacific | $43,908,481,891 | $35,344,399,445 | -19.5% | ||
| TOTAL WEST | $67,905,237,098 | $56,310,127,318 | -17.1% | ||
| TOTAL U.S. | $286,194,579,456 | $267,926,657,123 | -6.4% |
*Figures above are comprised of nonres building and engineering (i.e., residential is omitted).
Data Source and Table: ConstructConnect.


Qualifications to become a site manager in construction.
If you’ve been wondering ‘what qualifications do I need to be a site manager’ or ‘do I need a site manager Construction Skills Certification Scheme (CSCS) card’ to manage a construction site, then you’ve come to the right place.
Highly experienced and knowledgeable when it comes to the training required to work in the construction industry, the SB Skills Solutions team knows exactly what it takes to become a construction site manager.
To help you understand which qualifications are worth exploring and obtaining for this role, we explain the different site manager training routes and which one you should consider taking based on your prior workplace experience and skills.
What is the difference between a site manager and site supervisor?
While a site manager and a site supervisor may seem like interchangeable terms and roles, they actually have differing responsibilities. While a site supervisor position is generally an entry-level role, a site manager position requires either more relevant experience in the industry or a higher qualification.
Site managers tend to have the additional responsibility of managing several construction sites at once, whereas site supervisors typically concentrate on just one location.
What qualifications do you need to become a site manager?
Unlike some of the other positions on a construction site, site managers have a large amount of responsibility. As a result, they need to have the right site manager qualifications, skills, and experience to ensure the site is operating both efficiently and safely.
However, there’s not just one qualification every construction site manager possesses.
Site manager qualifications include:
- SMSTS (Site Management Safety Training Scheme)
- National Vocational Qualification (NVQ) Level 6 in Construction Site Management
- Level 6 Civil Engineering Site Management Degree
- Higher National Certificate (HNC) in Construction or related disciplines
- Higher National Diploma (HND) in Construction Management or related disciplines
- Foundation Degree in Construction Management
- Degree in Construction Management
- Apprenticeship in Construction Site Manager
- Higher Apprenticeship in Construction Site Manager
You may also need:
- High-Risk First Aid
- Confined Spaces (If it applies to the site)
- Qualifications in the work being carried out
Put simply, this means you can take a variety of routes and qualifications to become a construction site manager. Whether you want to become an apprentice, take an undergraduate degree, or apply for a work-based NVQ, there’s no end of options to explore.
It’s important to bear in mind, however, that each route will have different applicant requirements.
For example, to be considered for an apprenticeship in construction site management, you will need to have a grade C or 4 in GCSE English Language and Mathematics or equivalent level 2 qualifications.
What site manager NVQs do you need?
Equivalent to a bachelor’s degree, an NVQ Level 6 in Construction Site Management is a sought-after
qualification that can take anywhere from just four weeks up to 12 months to complete.
The course can be fast tracked, if desired, but the duration of the course depends mainly on the motivation and availability of the applicant. The ultimate NVQ course is designed to assess the competency of the applicant and is one of the highest qualifications you can achieve in the construction industry.
After obtaining this qualification, you will be one step closer to being able to apply for your site manager CSCS card (commonly known as a black card) which can help you to secure employment as a construction site manager.
What HS&E Test certificate do you need?
Before you can apply for a CSCS card, however, you will first need to pass the required level of CITB
(Construction Industry Training Board) Health, safety and environment (HS&E) test within the past two years.
To apply for a manager CSCS card, you will need to apply for and pass the CITB Managers and Professionals HS&E test or an approved alternative. You can use CSCS’s card finder to discover which CSCS card you are eligible to apply for based on either your occupation or qualification.
Alternatively, if you know which HS&E test certificate you require to obtain your desired position in the construction industry, then you can book your HS&E test here.
How do you get a Black CSCS Card?
Keen to obtain your black card from CSCS? If so, you will need both the relevant NVQ qualification as well as a completed CITB Managers and Professionals HS&E test. If you’ve taken an SMSTS course, then this can be put towards achieving your NVQ Level 6 in Construction Site Management.
If you’re not sure how your current qualifications can help you to become a construction site manager or want more information regarding the site manager CSCS card, then contact the experts at SB Skills Solutions.
We can provide you with professional guidance and advice, and direct you towards relevant site manager training courses.
Find out more about becoming a construction site manager
If you’d like to learn more about becoming a construction site manager, obtaining your black CSCS managers card, or you require more information regarding the site manager qualifications you can obtain at SB Skills Solutions, please feel free to get in touch with our team today.
Our Construction Site Management NVQ Level 6 qualification is ideal for individuals that are already working in the construction industry and are eager to increase their earning potential.
This course is designed to help the participants build their construction competence, skills, experience, and knowledge.
Every NVQ assessor at SB Skills Solutions has at least ten years of relevant experience and possesses either the Level 6 Construction Site manager NVQ, PTLLS (Preparing to Teach in the Lifelong Learning Sector), or Assessor Award, so you can rest assured that you’re in highly knowledgeable hands.
The site management course paired with our qualified assessors can ensure you have everything you need to begin a career as a construction site manager. To find out more about this Level 6 qualification, please don’t hesitate to contact our friendly team today.
To speak directly to a member of our team, simply give us a call on 01695 558420. Alternatively, you can also get in touch by sending your enquiry via email to info@sbskills.co.uk.


Keen to explore all your career options – including a position as a plant operator?
Luckily, the team of expert tutors at SB Skills Solutions have helped countless companies upskill their employees as well as numerous individuals obtain essential qualifications to achieve their dream job in the construction industry and further afield.
From the average plant operator salary in the UK to which qualifications, skills, and training courses can help you to become a plant operator, we explain everything you want to know about this profession.
What do construction plant operator jobs involve?
As a plant operator, you’ll be required to carry out a wide range of tasks. Primarily, this will include the operation, monitoring, and maintenance of heavy machinery like diggers, bulldozers, cranes, and excavators.
With help from these machines, you may be asked to move, excavate, lift, or crush building materials or organic matter.
In the event that these machines stop working or develop inefficiencies, a plant operator will be on hand to rectify any issues and support productivity. This role tends to also cover the maintenance of these machines, ensuring they’re in good working order.
A more comprehensive list of plant operator responsibilities can include:
- Supervising and overseeing operations
- Monitoring process parameters
- Performing maintenance tests
- Ensuring safety rules are followed
- Operating heavy machinery and equipment
- Transporting a variety of materials
A construction plant operator may have more specific daily duties such as:
- Operating forklifts, bulldozers, excavators, trucks, and more heavy machinery
- Transporting and storing building materials and earth
- Carrying out safety checks
- Level out working areas
- Communicate using radio signals
What are the working conditions like?
A construction plant operator will often be required to work outdoors in a range of weather conditions. Construction sites aren’t squeaky clean like an office or control room. You may work at heights such as operating a tower crane or a large excavator.
Instead, the working conditions for a construction plant operator tend to be significantly dirtier and nosier than alternative plant operator positions. Due to the nature of the building construction industry, you may also be required to work nights or weekends in order to deliver the necessary progress within the set construction deadline and budget.
How much does a plant operator earn?
According to information published by Totaljobs, a plant operator salary in the UK varies between £27,681 and £37,500, with an average annual salary of £32,500. It’s worth bearing in mind that the exact salary for this position will naturally vary depending on the location of the job and the industry that you work in.
Higher-paying positions are more accessible to individuals that upskill themselves, allowing them to work in a wider range of relevant industries. This is because plant operators tend to specialise in just one type of equipment.
What skills do I need to become a plant operator?
Unsure whether you have the necessary skills to become a plant operator? Below, we list some of the most common skills plant operators possess that can help them to succeed in both this role and their chosen industry. These plant operator skills include:
- An interest in heavy machinery and equipment
- Ability to operate, fix, and maintain machinery
- Understanding of engineering, maths, and computers
- Problem-solving capabilities
- Ability to use relevant computer software
- Strong attention to detail
- Excellent teamwork skills
- Ability to work independently
- Able to work well under pressure
Construction plant operators must also possess certain physical skills like excellent movement and coordination.
What qualifications do construction plant operators need?
In England, if you want to become a construction plant operator, you could obtain either your Level 2 NVQ (National Vocational Qualification – practical, work-based qualifications) in Construction Plant Operations, your Level 2 Construction Plant Operative Apprenticeship qualification, or your Level 3 Diploma in Construction and the Built Environment.
In addition to these qualifications, you may also need to apply for your blue CPCS (Construction Plant Competence Scheme) Competence Card or your CSCS (Construction Skills Certification Scheme) accreditation to work on a construction site as a plant operator.
What courses and training can I take to become a plant operator?
There are many routes you can take to become a plant operator. Some of these avenues involve applying for an apprenticeship, while others require work experience in the relevant industry to get you started.
To help you determine which route might be right for you, we explore each of these avenues in more detail.
College or training provider
As mentioned above, a course from either a college or training provider in Level 2 Certificate in Construction Plant Operations or Level 3 Diploma in Construction and the Built Environment can provide you with the relevant qualifications to become a plant operator.
While these courses will cover most of the required skills to join this profession, on-site experience is also crucial to obtaining a construction plant operator role, so many applicants will seek out a trainee position on a construction site following completion of the course.
For the level 2 course, you’ll need two or more GCSEs at grades 9 to 3 (A* to D), while a level 3 course requires four or five GCSEs at grades 9 to 4 (A* to C). Without GCSEs, you must hold an equivalent qualification.
Trade work
Working your way up is one of the more common ways you can become a plant operator. Often, if you’re enthusiastic enough and willing to work hard to obtain the relevant plant operator skills and qualifications, many employers will consider offering individual work as a general labourer with training opportunities.
They may request certain GCSEs grades (in subjects like English, maths, and technology), but they can provide you with invaluable on-site experience with heavy machinery and equipment.
Once you’ve gained enough experience and knowledge of the construction industry, they may contact a training provider to help you obtain the relevant qualifications to become a plant operator.
Career path and progression
Once you’ve managed to secure a plant operator position, there is still room for career progression. Often, one of the best ways to both increase your earning potential and develop your career in this industry is to specialise in a broader range of machines and equipment. This will allow you to work in different plants and positions.
Contact SB Skills Solutions
If the potential for career progression and the day-to-day duties of a construction plant operator seems like a good fit for your skills and professional aspirations, why not get in touch with the knowledgeable team at SB Skills Solutions to find out more about our plant operator course?
Our qualified team of experienced assessors can help you to obtain your NVQ Level 2 Plant Operations qualification, and by extension, achieve your blue CPCS Competence Card.
Recognised by the Construction Plant Competence Scheme (CPCS) and NPORS this NVQ can increase your earning potential while providing you with sought-after skills, experience, and competence in plant operation.
With the right support, we can ensure you learn the relevant skills and knowledge to become a plant operator. To find out more about the contents of the plant operator course, our prices, or alternative construction training courses, please don’t hesitate to contact our friendly team today.
To speak directly to a member of our team, simply give us a call on 01695 558420. We also welcome enquiries submitted via email to info@sbskills.co.uk. After receiving your plant operator course enquiry, we’ll ensure a prompt response to your query or a schedule a call to learn more about your training requirements.

Construction site managers are responsible for small sections of a construction project all the way through to management of entire development projects.
This role is diverse and not for everyone, but if you feel that you can take on the responsibility of a construction site manager, then look no further.
The team of expert training providers at SB Skills Solutions has created the only guide you’ll need to become a building site manager. Use this guide as your map to your future construction site manager job!
Below, we explore the role, earning potential, and day-to-day duties of a building site manager. We also explain which site management qualifications are necessary to obtain this position and the routes you can take to secure a construction site manager role.
What is a site manager?
A building site manager (also referred to as a construction site manager or site agent) is in charge of overseeing the day-to-day running of a construction site. Their role revolves around supervising the construction project as a whole, so they have the responsibility of ensuring every contractor is working safely and efficiently.
As well as liaising with contractors, they’ll also commonly work alongside architects and surveyors. A construction site manager helps the entire team stay on track, ensuring the building project is finished on time and within budget.
A building site manager will generally work in one of the five project groups; residential, commercial, industrial, environmental, or infrastructure. Your experience and area of interest in construction will often dictate which group you end up working in.
What does a site manager do?
Due to the supervisory nature of this position, the roles of a site manager are wide and varied. Depending on the size of the building project, these duties can range from ensuring the project stays on budget to ordering materials and liaising with clients.
It’s important to also note that a building site manager must be versatile as they will often be required to split their time between working on-site, working in an office, and working in a temporary office built on site. Frequently working in a variety of weathers (hot, cold, and wet!), they must be content wearing protective and high-visibility clothing, too.
While construction site managers tend to work the standard working week, they may be expected to work during weekends or evenings in order to meet deadlines, when necessary. Alternatively, the nature of some construction projects means the building work can only be undertaken at night or during public holidays.
As a building site manager, you may be required to:
- Supervise workers
- Hire subcontractors
- Monitor and report progress to staff
- Liaise with clients
- Purchase materials for the project
- Conduct safety inspections
- Carry out quality inspections
- Motivate the construction team
- Solve problems
- Prepare and create progress reports
- Analyse site reports, designs, and drawings
- Utilise specialist computer programmes
- Work in a variety of environments
- Liaise with the community and handle public demands
- Interpersonal skills
How much does a construction site manager earn?
The part you’ve all been looking for, so we will get it over with now. According to Check a Salary, a site manager in construction can earn anywhere between £37,500 to £74,880 per year!
With an average annual salary of £56,996 in the UK, there’s scope to earn a higher salary as a construction site manager if you move into more specialised roles or start your own construction-related business.
It’s also worth bearing in mind that the exact salary for this position will naturally vary depending on the location, employer, and level of responsibility. You could also improve your earning potential and career options by gaining chartered status to help showcase your competency to prospective clients and future employers.
Construction manager qualifications in the UK
Wondering ‘what qualifications do I need to be a site manager’? As you might imagine, construction site managers need higher level qualifications than most site workers as they are responsible for everything on site.
If you already work within the construction industry, you may be able to become a construction site manager by completing some site manager training courses. Site manager qualifications include:
You may also need:
- High-Risk First Aid
- Confined Spaces (If it applies to the site)
- Qualifications in the work being carried out
SMSTS
The SMSTS is a management course designed to teach managers or potential managers, the legislation involved in the building, construction, and civil engineering industries.
Construction Site Managers will also learn the importance of carrying out risk assessments, putting control measures in place, and adhering to health and safety regulations in order to create a culture of safety awareness.
The SMSTS course is a 5-day classroom-based learning experience that is valid for 5 years. This can be renewed with a short 2-day refresher.
NVQ Level 6 in Construction Site Management
The NVQ Level 6 in Construction Site Management is one of the highest levels available and is equivalent to a bachelor’s degree.
Taking anywhere between 4 weeks to 12 months to complete (depending on the applicant’s availability, motivation, and desire to fast track the course), this course is an in-depth assessment of your competency at construction site management. This is one of the ultimate NVQs in the construction industry with very few above it.
Not only does this NVQ in construction site management prove you are a competent site manager, you are then able to apply for your Black CSCS managers card which can be used to access construction sites and work as a manager.
What is the black CSCS card and why do you need it?

The Black CSCS Card is a construction site manager card that proves your competency in managing sites. This card proves to employers that you are qualified for the job and you can work safely on a construction site.
Employers need to prove that they are compliant with Construction Design and Management regulations (CDM) which aims to ensure everyone has the correct skills and qualifications for the job role they are completing.
Having the Black CSCS Card has also shown to increase your earning potential and job offers. Employers like to see that a potential employee is competent already and this card shows just that. Employers will know that after a short company induction, you’ll be ready to hit the ground running and won’t need your hand, held every step of the way.
How to become a construction manager
Getting a job as a construction site manager may seem daunting, but with the right skills, experience, and qualifications (which we can equip you with), you’ll be there in no time. There are a few routes that you can take to become a construction site manager, the first route is the apprenticeship route.
University
The university route is also an option if you want to become a building site manager as it will teach you everything you need to know about construction site management. Each university course will have specific entry requirements, with the duration of study often being between three and four years.
Depending on your A-level results, level 3 diploma qualifications, or your life experience if you’re applying as a mature student, you will have the choice of taking a foundation degree, a Higher National Diploma (HND), or an undergraduate degree accredited by the Chartered Institute of Building (CIOB).
Suitable subjects of study for one of these construction-related university degrees include building studies, estimating, and surveying, alongside construction, and civil engineering.
The SMSTS management course is also available to those with a bachelor’s degree. It explains the importance of risk assessments, control measures, and health and safety regulations to provide site managers with a comprehensive overview of construction legislation. Valid for five years, this course takes roughly six months to complete.
The only downside to this route is that you won’t be able to apply for the Black CSCS card. However, you can apply for the academically qualified card which is also a very prestigious card.
Work
If you’d rather take a more traditional route, you may decide to find a job in a relevant trade (such as an estimator, building technician, surveyor, or site supervisor). From there, you can take courses that will upskill you and work your way up to management.
This could be a lengthy process, but chances are if you’re reading this, you’re almost there and looking to progress. From this point, you should undertake your SMSTS course and look to achieve your Black CSCS card.
Skills
If you want to increase your chances of obtaining either employment or professional experience within the construction industry, with a view to becoming a building site manager, you may want to consider expanding upon your current skillset.
Some additional skills that could help you to achieve your goal of becoming a construction site manager include:
- Time management
- Leadership qualities
- Understanding of construction
- Excellent verbal communication skills
- Problem-solving abilities
- Business management
- Strong desire to take initiative
- Organisational skills
- Maths knowledge
- Computer literacy and the ability to use relevant software
What are the career prospects of a construction site manager?
In terms of career progression, it’s common for building site managers to become contract managers or project consultants, or to specialise in a certain area of construction such as building inspection or estimation.
Becoming chartered through the CIOB is often the first step into building on your professional prospects as it’ll provide you with more career options.
Construction site manager courses at SB Skills Solutions
If you’d like to explore the more traditional route of finding a job in trade and then taking a construction site manager course, contact SB Skills Solutions today.
With the Construction Site Management NVQ Level 6 qualification under your belt, you can increase your earning potential, secure a sought-after building site manager position, and work on your construction skills, competence, experience, and knowledge.
Guided by the experienced NVQ assessors at SB Skills Solutions (every assessor holds the Level 6 Construction Site manager NVQ, PTLLS (Preparing to Teach in the Lifelong Learning Sector), or Assessor Award with a minimum of ten years of relevant experience), we make obtaining this qualification straightforward.
With the support of our qualified assessors, you can achieve all the necessary qualifications to be a site manager. To learn more about the course, its contents, or our prices, please don’t hesitate to contact us today.
You can also call us on 01695 558420 or send us your enquiry in an email to info@sbskills.co.uk. Once we’ve received your enquiry, you can rest assured that a member of our team will be in touch soon to find out more about your site manager training requirements.

-
Jobs2 years ago
Project Manager – Oxford
-
Jobs3 years ago
Commissioning Engineer Security Industry
-
Jobs2 years ago
Airport Retail Sales Assistants
-

 Business5 years ago
How To Renovate a Victorian House
-

 Business3 years ago
How to Get a Gold Supervisory CSCS Card
-
Jobs2 years ago
PASMA labourer in Cirencester
-

 Tech3 years ago
It Won’t Make You the $6 Million Man, But Hilti’s EXO-10 May Save Your Arms, Back
-

 Tech2 years ago
Komatsu launches new HD1500-8E0 rigid-frame dump truck